Download
1 / 35
350 likes | 488 Views
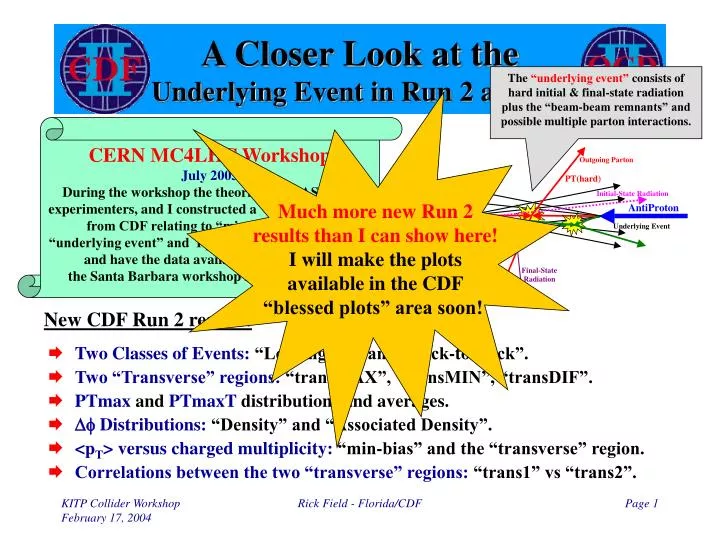
A Closer Look at the Underlying Event in Run 2 at CDF. The “underlying event” consists of hard initial & final-state radiation plus the “beam-beam remnants” and possible multiple parton interactions. Much more new Run 2 results than I can show here! I will make the plots

E N D
A Closer Look at theUnderlying Event in Run 2 at CDF The “underlying event” consists of hard initial & final-state radiation plus the “beam-beam remnants” and possible multiple parton interactions. Much more new Run 2 results than I can show here! I will make the plots available in the CDF “blessed plots” area soon! CERN MC4LHC Workshop July 2003 During the workshop the theorists, ATLAS/CMS experimenters, and I constructed a “wish list” of data from CDF relating to “min-bias” and the “underlying event” and I promised to do the analysis and have the data available by the time of the Santa Barbara workshop in February 2004. • Two Classes of Events: “Leading Jet” and “Back-to-Back”. • Two “Transverse” regions: “transMAX”, “transMIN”, “transDIF”. • PTmax and PTmaxT distributions and averages. • Df Distributions: “Density” and “Associated Density”. • <pT> versus charged multiplicity: “min-bias” and the “transverse” region. • Correlations between the two “transverse” regions: “trans1” vs “trans2”. New CDF Run 2 results! Rick Field - Florida/CDF
The “Transverse” Regionsas defined by the Leading Jet Look at the charged particle density in the “transverse” region! Charged Particle Df Correlations pT > 0.5 GeV/c |h| < 1 • Look at charged particle correlations in the azimuthal angle Df relative to the leading calorimeter jet (JetClu R = 0.7, |h| < 2). • Define |Df| < 60o as “Toward”, 60o < -Df < 120o and 60o < Df < 120o as “Transverse 1” and “Transverse 2”, and |Df| > 120o as “Away”. Each of the two “transverse” regions have area DhDf = 2x60o = 4p/6. The overall “transverse” region is the sum of the two transverse regions (DhDf = 2x120o = 4p/3). “Transverse” region is very sensitive to the “underlying event”! Rick Field - Florida/CDF
3 charged particles dNchg/dhdf = 3/4p = 0.24 1 charged particle Divide by 4p 1 GeV/c PTsum dNchg/dhdf = 1/4p = 0.08 3 GeV/c PTsum dPTsum/dhdf = 1/4p GeV/c = 0.08 GeV/c dPTsum/dhdf = 3/4p GeV/c = 0.24 GeV/c Particle Densities Charged Particles pT > 0.5 GeV/c |h| < 1 • Study the charged particles (pT > 0.5 GeV/c, |h| < 1) and form the charged particle density, dNchg/dhdf, and the charged scalar pT sum density, dPTsum/dhdf. CDF Run 2 “Min-Bias” DhDf = 4p = 12.6 Rick Field - Florida/CDF
AVE “transverse” (Trans 1 + Trans 2)/2 1 charged particle in the “transverse 2” region dNchg/dhdf = 1/(4p/6) = 0.48 “Transverse”Particle Densities Charged Particles pT > 0.5 GeV/c |h| < 1 • Study the charged particles (pT > 0.5 GeV/c, |h| < 1) in the “Transverse 1” and “Transverse 2” and form the charged particle density, dNchg/dhdf, and the charged scalar pT sum density, dPTsum/dhdf. Area = 4p/6 • The average “transverse” density is the average of “transverse 1” and “transverse 2”. Rick Field - Florida/CDF
Leading Jet Charged Particle DensityDf Dependence • Shows the Df dependence of the charged particle density, dNchg/dhdf, for charged particles in the range pT > 0.5 GeV/c and |h| < 1 relative to jet#1 (rotated to 270o) for “leading jet” events 30 < ET(jet#1) < 70 GeV. Log Scale! Min-Bias 0.25 per unit h-f • Also shows charged particle density, dNchg/dhdf, for charged particles in the range pT > 0.5 GeV/c and |h| < 1 for “min-bias” collisions. Rick Field - Florida/CDF
Charged Particle DensityDf Dependence Refer to this as a “Leading Jet” event • Look at the “transverse” region as defined by the leading jet (JetClu R = 0.7, |h| < 2) or by the leading two jets (JetClu R = 0.7, |h| < 2). “Back-to-Back” events are selected to have at least two jets with Jet#1 and Jet#2 nearly “back-to-back” (Df12 > 150o) with almost equal transverse energies (ET(jet#2)/ET(jet#1) > 0.8). Subset Refer to this as a “Back-to-Back” event • Shows the Df dependence of the charged particle density, dNchg/dhdf, for charged particles in the range pT > 0.5 GeV/c and |h| < 1 relative to jet#1 (rotated to 270o) for 30 < ET(jet#1) < 70 GeV for “Leading Jet” and “Back-to-Back” events. Rick Field - Florida/CDF
0.5 1.0 1.5 2.0 Charged Particle DensityDf Dependence “Leading Jet” “Back-to-Back” Polar Plot • Shows the Df dependence of the charged particle density, dNchg/dhdf, for charged particles in the range pT > 0.5 GeV/c and |h| < 1 relative to jet#1 (rotated to 270o) for 30 < ET(jet#1) < 70 GeV for “Leading Jet” and “Back-to-Back” events. Rick Field - Florida/CDF
“Transverse” PTsum Densityversus ET(jet#1) “Leading Jet” “Back-to-Back” Min-Bias 0.24 GeV/c per unit h-f • Shows the average charged PTsum density, dPTsum/dhdf, in the “transverse” region (pT > 0.5 GeV/c, |h| < 1) versus ET(jet#1) for “Leading Jet” and “Back-to-Back” events. • Compares the (uncorrected) data with PYTHIA Tune A and HERWIG after CDFSIM. Rick Field - Florida/CDF
“Transverse” PTsum Densityversus ET(jet#1) 30-70 GeV 95-130 GeV Very little dependence on ET(jet#1) in the “transverse” region for “back-to-back” events! Rick Field - Florida/CDF
“TransDIF” PTsum Densityversus ET(jet#1) “Leading Jet” “Back-to-Back” “MAX-MIN” is very sensitive to the “hard scattering” component of the “underlying event”! • Use the leading jet to define the MAX and MIN “transverse” regions on an event-by-event basis with MAX (MIN) having the largest (smallest) charged PTsum density. • Shows the “transDIF” = MAX-MIN charge PTsum density, dPTsum/dhdf, for pT > 0.5 GeV/c, |h| < 1 versus ET(jet#1) for “Leading Jet” and “Back-to-Back” events. Rick Field - Florida/CDF
“TransMIN” PTsum Densityversus ET(jet#1) “Leading Jet” “Back-to-Back” “transMIN” is very sensitive to the “beam-beam remnant” component of the “underlying event”! • Use the leading jet to define the MAX and MIN “transverse” regions on an event-by-event basis with MAX (MIN) having the largest (smallest) charged particle density. • Shows the “transMIN” charge particle density, dNchg/dhdf, for pT > 0.5 GeV/c, |h| < 1 versus ET(jet#1) for “Leading Jet” and “Back-to-Back” events. Rick Field - Florida/CDF
“Transverse” PTsum DensityPYTHIA Tune A vs HERWIG “Leading Jet” “Back-to-Back” Now look in detail at “back-to-back” events in the region 30 < ET(jet#1) < 70 GeV! • Shows the average charged PTsum density, dPTsum/dhdf, in the “transverse” region (pT > 0.5 GeV/c, |h| < 1) versus ET(jet#1) for “Leading Jet” and “Back-to-Back” events. • Compares the (uncorrected) data with PYTHIA Tune A and HERWIG after CDFSIM. Rick Field - Florida/CDF
Charged PTsum DensityPYTHIA Tune A vs HERWIG HERWIG (without multiple parton interactions) does not produces enough PTsum in the “transverse” region for 30 < ET(jet#1) < 70 GeV! Rick Field - Florida/CDF
dPT/dhdf + 0.2 GeV/c Charged PTsum DensityPYTHIA Tune A vs HERWIG 308 MeV in R = 0.7 cone! • Add 0.2 GeV/c per unit h-f to HERWIG scalar PTsum density, dPTsum/dhdf. • This corresponds to 0.2 x 4p = 2.5 GeV/c in the entire range pT > 0.5 GeV/c, |h| < 1. Rick Field - Florida/CDF
“Transverse” <pT> versus“Transverse” Nchg “Leading Jet” “Back-to-Back” Min-Bias • Look at the <pT> of particles in the “transverse” region (pT > 0.5 GeV/c, |h| < 1) versus the number of particles in the “transverse” region: <pT> vs Nchg. • Shows <pT> versus Nchg in the “transverse” region (pT > 0.5 GeV/c, |h| < 1) for “Leading Jet” and “Back-to-Back” events with 30 < ET(jet#1) < 70 GeV compared with “min-bias” collisions. Rick Field - Florida/CDF
Highest pT particle in the “transverse” region! “Transverse” PTmaxversus ET(jet#1) “Leading Jet” “Back-to-Back” Min-Bias • Use the leading jet to define the “transverse” region and look at the maximum pT charged particle in the “transverse” region, PTmaxT. • Shows the average PTmaxT, in the “transverse” region (pT > 0.5 GeV/c, |h| < 1) versus ET(jet#1) for “Leading Jet” and “Back-to-Back” events compared with the average maximum pT particle, PTmax, in “min-bias” collisions (pT > 0.5 GeV/c, |h| < 1). Rick Field - Florida/CDF
Min-Bias “Associated”Charged Particle Density “Associated” densities do not include PTmax! Highest pT charged particle! • Use the maximum pT charged particle in the event, PTmax, to define a direction and look at the the “associated” density, dNchg/dhdf, in “min-bias” collisions (pT > 0.5 GeV/c, |h| < 1). It is more probable to find a particle accompanying PTmax than it is to find a particle in the central region! • Shows the data on the Df dependence of the “associated” charged particle density, dNchg/dhdf, for charged particles (pT > 0.5 GeV/c, |h| < 1, not including PTmax) relative to PTmax (rotated to 180o) for “min-bias” events. Also shown is the average charged particle density, dNchg/dhdf, for “min-bias” events. Rick Field - Florida/CDF
Min-Bias “Associated”Charged Particle Density Rapid rise in the particle density in the “transverse” region as PTmax increases! PTmax > 2.0 GeV/c Transverse Region Transverse Region Ave Min-Bias 0.25 per unit h-f PTmax > 0.5 GeV/c • Shows the data on the Df dependence of the “associated” charged particle density, dNchg/dhdf, for charged particles (pT > 0.5 GeV/c, |h| < 1, not including PTmax) relative to PTmax (rotated to 180o) for “min-bias” eventswith PTmax > 0.5, 1.0, and 2.0 GeV/c. • Shows “jet structure” in “min-bias” collisions (i.e.the “birth” of the leading two jets!). Rick Field - Florida/CDF
Back-to-Back “Associated”Charged Particle Densities Maximum pT particle in the “transverse” region! “Associated” densities do not include PTmaxT! • Use the leading jet in “back-to-back” events to define the “transverse” region and look at the maximum pT charged particle in the “transverse” region, PTmaxT. • Look at the Df dependence of the “associated” charged particle and PTsum densities, dNchg/dhdf and dPTsum/dhdf for charged particles (pT > 0.5 GeV/c, |h| < 1, not including PTmaxT) relative to PTmaxT. • Rotate so that PTmaxT is at the center of the plot (i.e. 180o). Rick Field - Florida/CDF
Back-to-Back “Associated”Charged Particle Density “Associated” densities do not include PTmaxT! Jet#2 Region ?? Log Scale! • Look at the Df dependence of the “associated” charged particle density, dNchg/dhdf for charged particles (pT > 0.5 GeV/c, |h| < 1, not including PTmaxT) relative to PTmaxT (rotated to 180o) for PTmaxT > 0.5 GeV/c, PTmaxT > 1.0 GeV/c and PTmaxT > 2.0 GeV/c, for “back-to-back” eventswith 30 < ET(jet#1) < 70 GeV . • Shows “jet structure” in the “transverse” region (i.e.the “birth” of the 3rd & 4th jet). Rick Field - Florida/CDF
Back-to-Back “Associated”Charged Particle Densities “Back-to-Back” charge density “Back-to-Back” “associated” density • Shows the Df dependence of the “associated” charged particle density, dNchg/dhdf for charged particles (pT > 0.5 GeV/c, |h| < 1, not including PTmaxT) relative to PTmaxT (rotated to 180o) for PTmaxT > 0.5 GeV/c, PTmaxT > 1.0 GeV/c and PTmaxT > 2.0 GeV/c, for “back-to-back” eventswith 30 < ET(jet#1) < 70 GeV. It is more probable to find a particle accompanying PTmaxT than it is to find a particle in the “transverse” region! • Shows Df dependence of the charged particle density, dNchg/dhdf for charged particles (pT > 0.5 GeV/c, |h| < 1) relative to jet#1 (rotated to 270o) for “back-to-back events” with 30 < ET(jet#1) < 70 GeV. Rick Field - Florida/CDF
0.5 1.0 1.5 2.0 Back-to-Back “Associated”Charged Particle Densities “Back-to-Back” charge density “Back-to-Back” “associated” density Polar Plot • Shows the Df dependence of the “associated” charged particle density, dNchg/dhdf, pT > 0.5 GeV/c, |h| < 1 (not including PTmaxT) relative to PTmaxT (rotated to 180o) and the charged particle density, dNchg/dhdf, pT > 0.5 GeV/c, |h| < 1 relative to jet#1 (rotated to 270o) for “back-to-back events” with 30 < ET(jet#1) < 70 GeV. Rick Field - Florida/CDF
0.5 1.0 1.5 2.0 Back-to-Back “Associated”Charged Particle Densities “Back-to-Back” charge density “Back-to-Back” “associated” density Polar Plot • Shows the Df dependence of the “associated” charged particle density, dNchg/dhdf, pT > 0.5 GeV/c, |h| < 1, PTmaxT > 2.0 GeV/c (not including PTmaxT) relative to PTmaxT (rotated to 180o) and the charged particle density, dNchg/dhdf, pT > 0.5 GeV/c, |h| < 1, relative to jet#1 (rotated to 270o) for “back-to-back events” with 30 < ET(jet#1) < 70 GeV. Rick Field - Florida/CDF
0.5 1.0 1.5 2.0 Jet Topologies QCD Four Jet Topology QCD Three Jet Topology Polar Plot • Shows the Df dependence of the “associated” charged particle density, dNchg/dhdf, pT > 0.5 GeV/c, |h| < 1, PTmaxT > 2.0 GeV/c (not including PTmaxT) relative to PTmaxT (rotated to 180o) and the charged particle density, dNchg/dhdf, pT > 0.5 GeV/c, |h| < 1, relative to jet#1 (rotated to 270o) for “back-to-back events” with 30 < ET(jet#1) < 70 GeV. Rick Field - Florida/CDF
Back-to-Back “Associated”Charged Particle Density Jet#2 Region Log Scale! • Look at the Df dependence of the “associated” charged particle density, dNchg/dhdf, pT > 0.5 GeV/c, |h| < 1 (not including PTmaxT) relative to PTmaxT (rotated to 180o) for PTmaxT > 2.0 GeV/c for “back-to-back” eventswith 30 < ET(jet#1) < 70 GeV and 95 < ET(jet#1) < 130 GeV. • Very little dependence on ET(jet#1) in the “transverse” region for “back-to-back” events! Rick Field - Florida/CDF
Back-to-Back “Associated”Charged PTsum Density Jet#2 Region Log Scale! • Look at the Df dependence of the “associated” charged PTsum density, dPTsum/dhdf, pT > 0.5 GeV/c, |h| < 1 (not including PTmaxT) relative to PTmaxT (rotated to 180o) for PTmaxT > 2.0 GeV/c for “back-to-back” eventswith 30 < ET(jet#1) < 70 GeV and 95 < ET(jet#1) < 130 GeV. • Very little dependence on ET(jet#1) in the “transverse” region for “back-to-back” events! Rick Field - Florida/CDF
“Back-to-Back” vs “Min-Bias”“Associated” Charge Density “Birth” of jet#3 in the “transverse” region! “Back-to-Back” “Associated” Density “Min-Bias” “Associated” Density Log Scale! “Birth” of jet#1 in “min-bias” collisions! • Shows the Df dependence of the “associated” charged particle density, dNchg/dhdf for pT > 0.5 GeV/c, |h| < 1 (not including PTmaxT) relative to PTmaxT (rotated to 180o) for PTmaxT > 2.0 GeV/c, for “back-to-back” eventswith 30 < ET(jet#1) < 70 GeV. • Shows the data on the Df dependence of the “associated” charged particle density, dNchg/dhdf, pT > 0.5 GeV/c, |h| < 1 (not including PTmax) relative to PTmax (rotated to 180o) for “min-bias” eventswith PTmax > 2.0 GeV/c. Rick Field - Florida/CDF
“Back-to-Back” vs “Min-Bias”“Associated” PTsum Density “Birth” of jet#3 in the “transverse” region! “Back-to-Back” “Associated” Density “Min-Bias” “Associated” Density Log Scale! “Birth” of jet#1 in “min-bias” collisions! • Shows the Df dependence of the “associated” charged particle density, dNchg/dhdf for pT > 0.5 GeV/c, |h| < 1 (not including PTmaxT) relative to PTmaxT (rotated to 180o) for PTmaxT > 2.0 GeV/c, for “back-to-back” eventswith 30 < ET(jet#1) < 70 GeV. • Shows the data on the Df dependence of the “associated” charged particle density, dNchg/dhdf, pT > 0.5 GeV/c, |h| < 1 (not including PTmax) relative to PTmax (rotated to 180o) for “min-bias” eventswith PTmax > 2.0 GeV/c. Rick Field - Florida/CDF
“Associated” PTsum DensityPYTHIA Tune A vs HERWIG HERWIG (without multiple parton interactions) does not produce enough “associated” PTsum in the direction of PTmaxT! PTmaxT > 0.5 GeV/c And HERWIG (without multiple parton interactions) does not produce enough PTsum in the direction opposite of PTmaxT! Rick Field - Florida/CDF
For PTmaxT > 2.0 GeV both PYTHIA and HERWIG produce slightly too much “associated” PTsum in the direction of PTmaxT! “Associated” PTsum DensityPYTHIA Tune A vs HERWIG PTmaxT > 2 GeV/c But HERWIG (without multiple parton interactions) produces too few particles in the direction opposite of PTmaxT! Rick Field - Florida/CDF
“Transverse 1” Region vs“Transverse 2” Region “Leading Jet” “Back-to-Back” • Use the leading jet to define two “transverse” regions and look at the correlations between “transverse 1” and “transverse 2”. • Shows the average number of charged particles in the “transverse 2” region versus the number of charged particles in the “transverse 1” region for pT > 0.5 GeV/c and |h| < 1 for “Leading Jet” and “Back-to-Back” events. • Shows the average pT of charged particles in the “transverse 2” region versus the number of charged particles in the “transverse 1” region for pT > 0.5 GeV/c and |h| < 1 for “Leading Jet” and “Back-to-Back” events. Rick Field - Florida/CDF
“Transverse 1” Region vs“Transverse 2” Region Rick Field - Florida/CDF
Summary • There are some interesting correlations between the “transverse 1” and “transverse 2” regions both for “Leading-Jet” and “Back-to-Back” events! “Leading Jet” “Back-to-Back” • PYTHIA Tune A (with multiple parton scattering) does a much better job in describing these correlations than does HERWIG (without multiple parton scattering). Question: Is this a probe of multiple parton interactions? Rick Field - Florida/CDF
Summary • “Back-to-Back” events have less “hard scattering” (initial and final state radiation) component in the “transverse” region which allows for a closer look at the “beam-beam remnant” and multiple parton scattering component of the “underlying” event. • PYTHIA Tune A (with multiple parton scattering) does a much better job in describing the “back-to-back” events than does HERWIG (without multiple parton scattering). “Leading Jet” “Back-to-Back” Rick Field - Florida/CDF
Summary Next Step Look at the jet topologies (2 jet vs 3 jet vs 4 jet etc). See if there is an excess of 4 jet events due to multiple parton interactions! Max pT in the “transverse” region! “Associated” densities do not include PTmaxT! • The “associated” densities show strong correlations (i.e. jet structure) in the “transverse” region both for “Leading Jet” and “Back-to-Back” events. • The “birth” of the 1st jet in “min-bias” collisions looks very similar to the “birth” of the 3rd jet in the “transverse” region of hard scattering “Back-to-Back” events. Question: Is the topology 3 jet or 4 jet? Rick Field - Florida/CDF