Download
1 / 33
340 likes | 586 Views
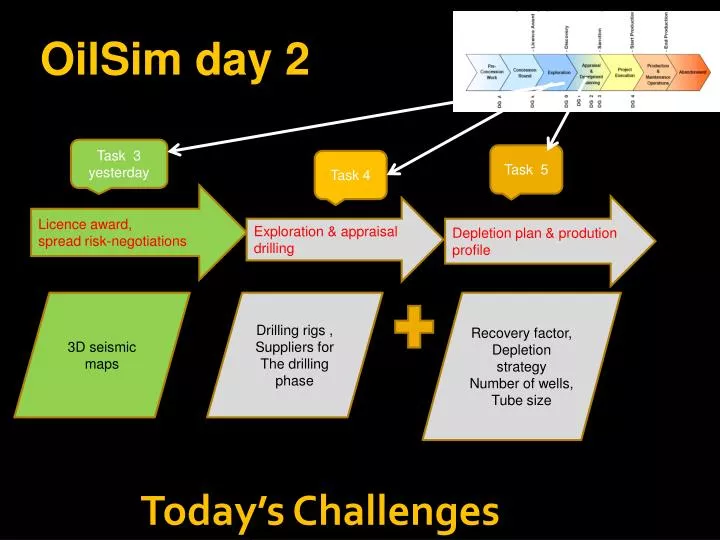
OilSim day 2. Task 3 yesterday. Task 5. Task 4. Licence award , spread risk-negotiations. Depletion plan & prodution profile. Exploration & appraisal drilling. 3D seismic maps. Drilling rigs , Suppliers for The drilling phase. Recovery factor , Depletion strategy

E N D
OilSim day 2 Task 3 yesterday Task 5 Task 4 Licenceaward, spreadrisk-negotiations Depletion plan & produtionprofile Exploration & appraisal drilling 3D seismicmaps Drilling rigs , Suppliers for The drilling phase Recoveryfactor, Depletionstrategy Numberofwells, Tube size Today’s Challenges
Choose rig Single Rigs Double Rigs Triple Rigs
Choose Rig Max drilling depth is important Rig cost = drilling days * day rate
Service provideres • Base camp (accomodation, cantine,+storage of equipment) • Transport on land, cars/trucs • Transport by air (personnel, equipment) • Well services (pipe, casing , drilling mud • Well analysis (electrical logs, cores)
Service providers Upto 9 Star quality- Good: normally costs more Bad: cheaper, but reliability is low, so you risk extra drilling time and extra costs
Environmental Impact Assessment • EIA survey: more knowledge about the area. • Less probability for drilling problems. • Less severe consequences if you run into problems.
Drill Position EIA: enviromental impact analysis shows where it may be difficult to drill. Place your mouse where to drill
Drilling position Layer 3 Eocene Layer 2 Paleocene Layer 1 Cretaceous
Drilling Result Proven volume (MBOE) counts Test may increase proven volume Remember to tick the boxes!
Value and ROI Volume Range, e.g. 1-897 Proven Reserves e.g. 1
Calculation of Value The total proven oil and gas = 18MBOE Allowing for 25% recovery factor 0.8 Production profile factor and 10% discount factor per year
Behind the scene calculation • 18MBOE x 25% recovery factor = 4.5MBOE • Sales price without discount factor ->4.5MBOE x $50 = $225,000,000 • Sales price allowing for production profile -> $225,000,000 x 0.8 (production factor) • = $180,000,000 • Reduced sales price with 10% discount factor per year • = $ 67,397,022
Appraisal From Probable volume to proven reserves
Narrowing ranges Exploration well: • 0 to 1572 MBOE (after drilling) • 11 to 1266 MBOE (after testing) First appraisal well: • 25 to 1033 MBOE (after drilling) • 34 to 910 MBOE (after testing) Second appraisal well: • 65 to 850 MBOE (after drilling) • 101 to 752 MBOE (after testing) Only proven MBOE counts
Increasing proven volumes Appraisal wells - proven reserves increase Range between proven and possible is decreased
Effect on calculation of licence Expected costs if you developed thefield (CAPEX) andproducedthe oil (OPEX) Now total expenses are lower than the sales value and so we have a positive licence value
Drilling Summary • After your first drill in each well, reprocess seismic • Decide which discoveries to drill how many appraisal wells into Ultimately, you should either: • Get a positive net present value, • Or a conclusion that additional appraisal wells will not result in a net present value
Apply for more funds Click on Apply for More Funds Tab. 1 KP for each $100,000 applied for. Answer the questions: All correct gives cash and you can keep CPs. One wrong gives cash and you keep ½ of your CPs. Two wrong gives ½ cash and you lose all CPs. All wrong, you get no cash and lose all CPs. Expensive money if less than 10 knowledge points: Apply for cash and be fined $5million for each $20million requested.
OilSimday 2 Task 3 yesterday Task 5 Task 4 Licenceaward, spreadrisk-negotiations Depletion plan & produtionprofile Exploration & appraisal drilling 3D seismicmaps Drilling rigs , Suppliers for The drilling phase Recoveryfactor, Depletionstrategy Numberofwells, Tube size Today’s Challenges
Challenge • Make a well plan for each reservoir in your block, choosing: • Number of production wells • Tubing size • Aiming to choose a plan that maximises value of block • Increased sales value • Decreased drilling costs
Nodal analysis • Read the maximum well flow rate • Most suitable Tube size Most suitable tube Highest well flow rate
Reservoir information 1. Click the Reservoir tab 2. Click the magnifyingglass for the reservoir 3. Study the data forthe reservoir
Improve value-revise well plan • Submit plans with different number of wells and tubing sizes • Review Reservoir information after each revised plan • Aiming to maximize sales value and minimize drilling costs, whilst increasing Recovery Factor • You can amend your well plans until the deadline • Credibility points – upto 100 kp if plans are optimal for all your reservoirs • After deadline – Value of Licence will be adjusted based on final Well Plan submitted
Area Depth Degree of fill ¯, S hc Reservoir- thickness Prospectevaluation Input data Hydrocarbon saturation Oil shrinkage / Formation volume factor Gas-oil-ratio Net to Gross Gross rock volume Porosity GRV x N/G x Phi x Shc x Bo/FVF x GOR = In-Place resources In place resources x Recovery factor = Recoverable oil/gas Minimum – Most likely – Maximum - of each parameter Monte Carlo simulate in GeoX Results P90 – Mean – P10 recoverable resources