Download
1 / 19
190 likes | 276 Views
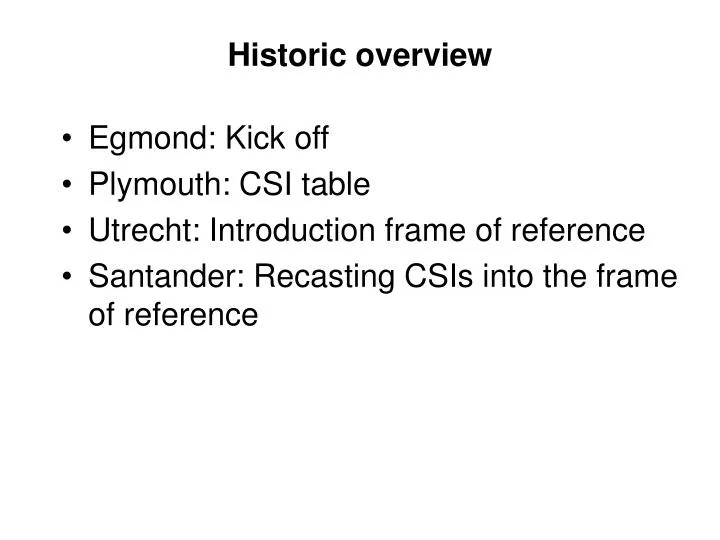
Historic overview. Egmond: Kick off Plymouth: CSI table Utrecht: Introduction frame of reference Santander: Recasting CSIs into the frame of reference. 3. Intervention procedure. 4. Evaluation procedure. Indicators Parameters Monitoring Measurement Modelling System knowledge. IBCSI.

E N D
Historic overview • Egmond: Kick off • Plymouth: CSI table • Utrecht: Introduction frame of reference • Santander: Recasting CSIs into the frame of reference
3. Intervention procedure 4. Evaluation procedure • Indicators • Parameters • Monitoring • Measurement • Modelling • System knowledge IBCSI Strategic objective Defined Not defined Momentary coastline Intertidal Coastline Operational objective Defined Beach width Exceedance curves 1. Quantitative state concept 2. Benchmarking procedure Not defined X Reference state Current state
Overview Dutch presentations • Arno (RIKZ): Introduction • Aart (UU): Scientific results and CSIs • highwater line and beachwidth • storm Egmond • Stefan (WL): Scientific results and CSIs • multiyear evolution of nourished beach (beach width) • video derived observations of longshore currents • Troels (UCo): Scientific results • Arno (RIKZ): Recasting scientific results into the frame of reference
3. Intervention procedure 4. Evaluation procedure • Indicators • Parameters • Monitoring • Measurement • Modelling • System knowledge IBCSI Strategic objective Defined Not defined Momentary coastline Intertidal Coastline Operational objective Defined Beach width Exceedance curves 1. Quantitative state concept 2. Benchmarking procedure Not defined X Reference state Current state
Example: Dynamic Preservation • Strategic objective: “Sustainable preservation of functions and values in the coastal zone” • Structural erosion no longer acceptable • Operational objective: “Maintain the coastline at its 1990 position”
“Maintaining the coastline at its 1990 position” 1. Momentary CoastLine (MCL) 3. Nourishment 4. Evaluation procedure • System knowledge • State indicators • JARKUS Frame of reference: Dynamic Preservation Not OK? “Sustainable preservation of functions and values” OK? 2. Benchmarking procedure BCL TCL
Video Array y = -130 m Survey Array y = -1500 m Video-based quantification of the MCL(Subtidal Beach Mapper, Aarninkhof 2003)
Working with the Intertidal coastline • Strategic objective: • sustainable preservation of functions and values • Operational objective: • maintain the coastline at its 1990 position • QSC: • location of the coastline based on the intertidal beach volume - MICL • Benchmarking procedure: • Reference:10 year regression of MICLs to find the 1990 coastline - BICL • Test:10 year regression of MICLs to find the year T coastline - TICL • Intervention procedure: • IF the TICL exceeds the BICL THEN nourish • Evaluation procedure: • Coastline will be maintained at its 1990 position • Maybe the existing procedure is represented but ARGUS data not effectively used NAP+3m (Dunefoot) NAP-5m MCL MICL
MCL & MICL (m) Time (months) Egmond MCL (surv.) and MICL (vid.) – Raw data MCL (survey) MCL & MICL (m) MICL (video) Time (months) Egmond MCL (surv.) and MICL (vid.) – Normalized data
Working with the high water line • Strategic objective: • guarantuee sustainable safety of beach property • Operational objective: • build no property seaward of the line with a 5% exceedance probability • QSC: • probability curves of the high water line • Benchmarking procedure: • Reference: location of the 5% exceedance line • Test: exceedance percentage of desired location • Intervention procedure: • IF percentage of desired location is too high THEN relocate • Evaluation procedure: • No property built at locations with exceedance probabilities higher than 5% • Long term developments unknown(system timescale & policy timescale)
Location of the exceedence curves of the high-tide levels 2001 14-09-2001 9 GMT
Working with beach width • Strategic objective: • guarantuee sustainable recreation on the beach • Operational objective: • maintain a minimal beach width for bathing people • QSC: • width of inter tidal and supra tidal beach (waterlines) • Benchmarking procedure: • Reference: minimal beach width (to be defined by the end user - municipalities) • Test: actual beach width as measured by ARGUS • Intervention procedure: • IF actual beachwidth smaller than reference beach width THEN nourish • Evaluation procedure: • Beach width maintained constant throughout the season • Nourishments during wintertime could be inefficient
a b c d Width of the inter-tidal & supra-tidal beach Inter-tidal beach Mean width = 80 m beach width (m) Y = -250m beach width (m) Y = -500m beach width (m) Y = -750m tidal range (m) Time: 2001-2002
a b c d Supra-tidal beach Mean width = 50-60 m beach width (m) Y = -250m beach width (m) Y = -500m beach width (m) Y = -750m tidal range (m) Time: 2001-2002
This presentation was brought to you by:Arno de KruifStefan AarninkhofAart KroonTroels AagaardSusanne QuartelMark van KoningsveldDiscussion