Download

1 / 110
1.11k likes | 1.47k Views
Section 2.1. Chapter 2. Exercise #13. Section 2.1. Chapter 2. Exercise #57. Section 2.1. Chapter 2. Exercise #99. Section 2.2. Chapter 2. Exercise #21. Section 2.2. Chapter 2. Exercise #37. Section 2.2. Chapter 2. Exercise #47. Section 2.2. Chapter 2. Exercise #73.

E N D
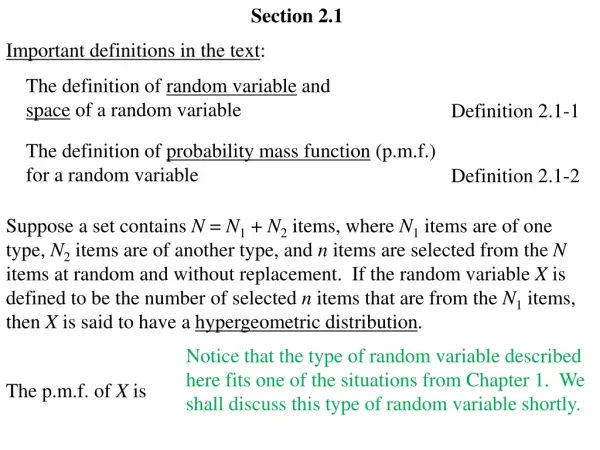
Section 2.1 Chapter 2 Exercise #13
Section 2.1 Chapter 2 Exercise #57
Section 2.1 Chapter 2 Exercise #99
Section 2.2 Chapter 2 Exercise #21
Section 2.2 Chapter 2 Exercise #37
Section 2.2 Chapter 2 Exercise #47
Section 2.2 Chapter 2 Exercise #73
A naturalist for a fish and game department estimated the total number of trout in a certain lake using the popular capture-mark-recapture technique. She netted, marked, and released 200 trout. A week later, allowing for thorough mixing, she again netted 200 trout and found 8 marked ones among them. Assuming that the ratio of marked trout to the total number in the second sample is the same as the ratio of all marked fish in the first sample to the total trout population in the lake, estimate the total number of fish in the lake.
Section 2.2 Chapter 2 Exercise #89
The table contains price-supply data and price-demand data for corn. Find a linear model y = f(x) for the price-supply data where x is price (in dollars) and y is supply (in billions of bushels).
Section 2.3 Chapter 2 Exercise #3
Section 2.3 Chapter 2 Exercise #25
Section 2.3 Chapter 2 Exercise #29
p(x) 5 x – 5 5 – 5
Section 2.3 Chapter 2 Exercise #51
Section 2.3 Chapter 2 Exercise #63
50’ x y
50’ x y
50’ x y
50’ x y
Section 2.4 Chapter 2 Exercise #15
Section 2.4 Chapter 2 Exercise #23
Section 2.4 Chapter 2 Exercise #37