Download
1 / 26
260 likes | 445 Views
The Normal Curve, Standardization and z Scores. Chapter 6. The Bell Curve is Born (1769). A Modern Normal Curve. Development of a Normal Curve: Sample of 5. Development of a Normal Curve: Sample of 30. Development of a Normal Curve: Sample of 140.

E N D
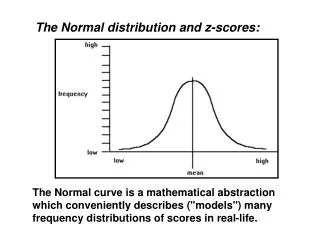
As the sample size increases, the shape of the distribution becomes more like the normal curve. • Can you think of variables that might be normally distributed? • Think about it: Can nominal (categorical) variables be normally distributed?
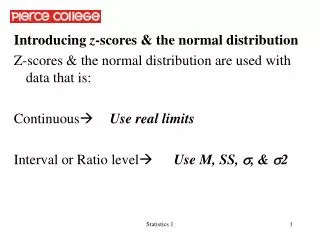
Standardization: allows comparisons z distribution Comparing z scores Standardization, z Scores, and the Normal Curve
Transforming Raw Scores to z Scores • Step 1: Subtract the mean of the population from the raw score • Step 2: Divide by the standard deviation of the population
Transforming z Scores into Raw Scores • Step 1: Multiply the z score by the standard deviation of the population • Step 2: Add the mean of the population to this product
Using z Scores to Make Comparisons • If you know your score on an exam, and a friend’s score on an exam, you can convert to z scores to determine who did better and by how much. • z scores are standardized, so they can be compared!
Comparing Apples and Oranges • If we can standardize the raw scores on two different scales, converting both scores to z scores, we can then compare the scores directly.
Transforming z Scores into Percentiles z scores tell you where a value fits into a normal distribution. Based on the normal distribution, there are rules about where scores with a z value will fall, and how it will relate to a percentile rank. You can use the area under the normal curve to calculate percentiles for any score.
Check Your Learning • If the mean is 10 and the standard deviation is 2: • If a student’s score is 8, what is z? • If a student’s scores at the 84th percentile, what is her raw score? z score? • Would you expect someone to have a score of 20?
Distribution of sample means is normally distributed even when the population from which it was drawn is not normal! A distribution of means is less variable than a distribution of individual scores. The Central Limit Theorem
Creating a Distribution of Scores These distributions were obtained by drawing from the same population.
Distribution of Means • Mean of the distribution tends to be the mean of the population. • Standard deviation of the distribution tends to be less than the standard deviation of the population. • The standard error: standard deviation of the distribution of means
The Normal Curve and Catching Cheaters • This pattern is an indication that researchers might be manipulating their analyses to push their z statistics beyond the cutoffs.
Check Your Learning • We typically are not interested in only the sample on which our study is based. How can we use the sample data to talk about the population?