Download
1 / 32
330 likes | 352 Views
Learn to solve and graph inequalities with <, ≤, >, or ≥ signs. Practice naming numbers, understanding number lines, and applying special cases. Explore absolute value, two-variable inequalities, and real-life applications. Enhance your skills to tackle any inequality problem effectively!

E N D
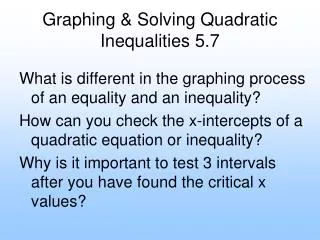
CHAPTER 6 REVIEW Solving and Graphing Inequalities
An inequality is like an equation, but instead of an equal sign (=) it has one of these signs: < : less than ≤ : less than or equal to > : greater than ≥ : greater than or equal to
“x < 5” means that whatever value x has, it must be less than 5. Try to name ten numbers that are less than 5!
-25 -20 -15 -10 -5 0 5 10 15 20 25 Numbers less than 5 are to the left of 5 on the number line. • If you said 4, 3, 2, 1, 0, -1, -2, -3, etc., you are right. • There are also numbers in between the integers, like 2.5, 1/2, -7.9, etc. • The number 5 would not be a correct answer, though, because 5 is not less than 5.
“x ≥ -2” means that whatever value x has, it must be greater than or equal to -2. Try to name ten numbers that are greater than or equal to -2!
-2 -25 -20 -15 -10 -5 0 5 10 15 20 25 Numbers greater than -2 are to the right of 5 on the number line. • If you said -1, 0, 1, 2, 3, 4, 5, etc., you are right. • There are also numbers in between the integers, like -1/2, 0.2, 3.1, 5.5, etc. • The number -2 would also be a correct answer, because of the phrase, “or equal to”.
-25 -20 -15 -10 -5 0 5 10 15 20 25 Where is -1.5 on the number line? Is it greater or less than -2? -2 • -1.5 is between -1 and -2. • -1 is to the right of -2. • So -1.5 is also to the right of -2.
Solve an Inequality w + 5 < 8 w + 5 + (-5) < 8 + (-5) All numbers less than 3 are solutions to this problem! w < 3
More Examples 8 + r ≥ -2 8 + r + (-8) ≥ -2 + (-8) r ≥ -10 All numbers from -10 and up (including -10) make this problem true!
More Examples x - 2 > -2 x + (-2) + (2) > -2 + (2) x > 0 All numbers greater than 0 make this problem true!
More Examples 4 + y ≤ 1 4 + y + (-4) ≤ 1 + (-4) y ≤ -3 All numbers from -3 down (including -3) make this problem true!
There is one special case. • Sometimes you may have to reverse the direction of the inequality sign!! • That only happens when you multiply or divide both sides of the inequality by a negative number.
-6 0 Example: • Subtract 5 from each side. • Divide each side by negative3. • Reverse the inequality sign. • Graph the solution. Solve: -3y + 5 >23 -5-5 -3y > 18 -3 -3 y < -6
Try these: -x -x x + 3 > 5 -3 -3 x > 2 + 11 + 11 -c > 34 -1 -1 c < -34 1.) Solve 2x + 3 > x + 5 2.)Solve - c – 11 >23 3.) Solve 3(r - 2) < 2r + 4 3r – 6 < 2r + 4 -2r -2r r – 6 < 4 +6 +6 r < 10
You did remember to reverse the signs . . . . . . didn’t you? Good job!
Example: -2 -2 We turned the sign! - 4x - 4x Ring the alarm! We divided by a negative! + 6 +6
Ex: Solve 6x-3 = 15 6x-3 = 15 or 6x-3 = -15 6x = 18 or 6x = -12 x = 3 or x = -2 * Plug in answers to check your solutions!
Ex: Solve 2x + 7 -3 = 8 Get the abs. value part by itself first! 2x+7 = 11 Now split into 2 parts. 2x+7 = 11 or 2x+7 = -11 2x = 4 or 2x = -18 x = 2 or x = -9 Check the solutions.
Ex: Solve & graph. • Becomes an “and” problem -3 7 8
Solve & graph. • Get absolute value by itself first. • Becomes an “or” problem -2 3 4
-4 3 Example 1: This is an ‘or’ statement. (Greator). Rewrite. In the 2nd inequality, reverse the inequality sign and negate the right side value. Solve each inequality. Graph the solution. • |2x + 1| > 7 • 2x + 1 > 7 or 2x + 1 >7 • 2x + 1 >7 or 2x + 1 <-7 • x > 3 or x < -4
2 8 Example 2: This is an ‘and’ statement. (Less thand). Rewrite. In the 2nd inequality, reverse the inequality sign and negate the right side value. Solve each inequality. Graph the solution. • |x -5|< 3 • x -5< 3 and x -5< 3 • x -5< 3 and x -5> -3 • x < 8 and x > 2 • 2 < x < 8
Case 1 Example: Absolute Value Inequalities and
Case 2 Example: Absolute Value Inequalities or OR
Absolute Value • Answer is always positive • Therefore the following examples cannot happen. . . Solutions: No solution
Graphing Linear Inequalities in Two Variables • SWBAT graph a linear inequality in two variables • SWBAT Model a real life situation with a linear inequality.
Some Helpful Hints • If the sign is > or < the line is dashed • If the sign is or the line will be solid When dealing with just x and y. • If the sign > or the shading either goes up or to the right • If the sign is < or the shading either goes down or to the left
When dealing with slanted lines • If it is > or then you shade above • If it is < or then you shade below the line
Graphing an Inequality in Two Variables Graph x < 2 Step 1: Start by graphing the line x = 2 Now what points would give you less than 2? Since it has to be x < 2 we shade everything to the left of the line.
Graphing a Linear Inequality Sketch a graph of y 3
Using What We Know Sketch a graph of x + y < 3 Step 1: Put into slope intercept form y <-x + 3 Step 2: Graph the line y = -x + 3