Download
1 / 9
90 likes | 110 Views
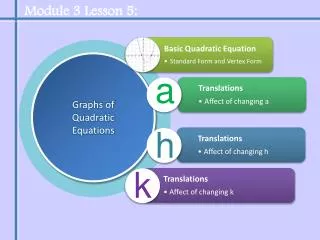
Learn about positive and negative quadratic graphs, adding or subtracting values, and fill in charts to visualize different parabola shapes.

E N D
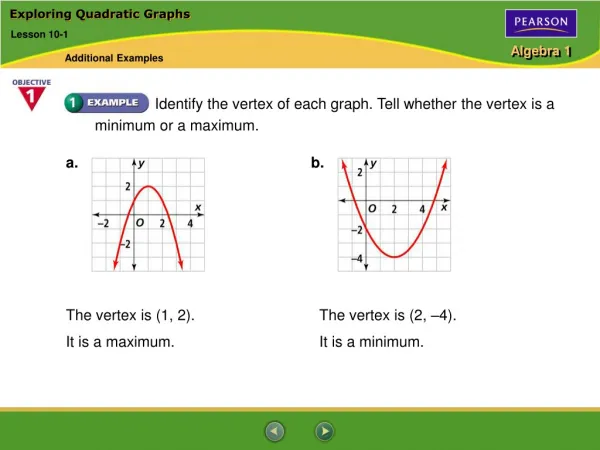
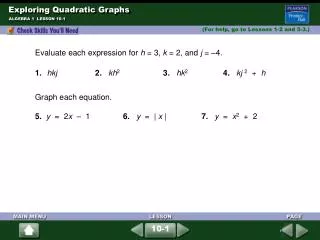
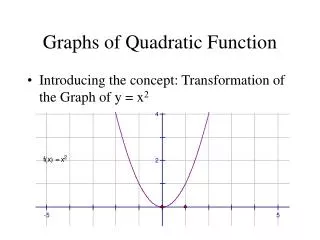
What does this quadratic graph look like? y = - x2 ?
What does this quadratic graph look like? y = x2 + 1 ? What does adding one do to the graph?
What does this quadratic graph look like? y = x2 + 2x + 1 ? Fill in the chart on your own please
What does this quadratic graph look like? y = x2 – 3 ? What does subtracting 3, do to the parabola?
What does this quadratic graph look like? y = x2 + 5x + 6 ? Please fill in the chart on your own.
Which of these are a happy face shape and which are a sad face shaped? y = x2 + 3x + 6 y = x2 + 3x - 6 y = x2 y = - x2 + 3x - 6 y = - x2 +3x + 6 - 3x - 6 y = - x2 - 3x + 6 y = x2 - 3x + 6 y = - x2 - 3x - 6