Download
1 / 6
70 likes | 195 Views
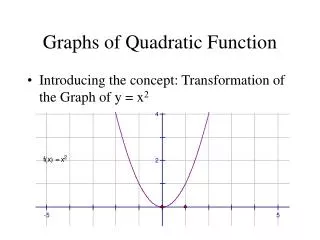
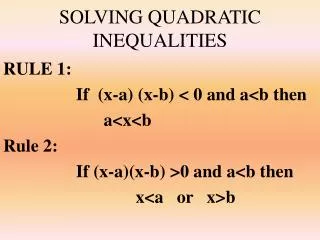
3.9 Graphs of Quadratic Inequalities. p. 96-101. Forms of Quadratic Inequalities y<ax 2 +bx+c y>ax 2 +bx+c y ≤ax 2 +bx+c y≥ax 2 +bx+c. Graphs will look like a parabola with a solid or dotted line and a shaded section. The graph could be shaded inside the parabola or outside.

E N D
3.9 Graphs of Quadratic Inequalities p. 96-101
Forms of Quadratic Inequalitiesy<ax2+bx+c y>ax2+bx+cy≤ax2+bx+c y≥ax2+bx+c • Graphs will look like a parabola with a solid or dotted line and a shaded section. • The graph could be shaded inside the parabola or outside.
Steps for graphing 1. Sketch the parabola y=ax2+bx+c. (dotted line for < or >, solid line for ≤ or ≥) ** remember to use 5 points for the graph! 2. Choose a test point and see whether it is a solution of the inequality. 3. Shade the appropriate region. (if the point is a solution, shade where the point is, if it’s not a solution, shade the other region)
Example:Graph y ≤ x2+6x- 4 Test point * Opens up, solid line * Vertex: (-3,-13) • Test Point: (0,0) • 0≤02+6(0)-4 • 0≤-4 So, shade where the point is NOT!
Graph: y>-x2+4x-3 Test Point * Opens down, dotted line. * Vertex: (2,1) • x y • 0 -3 • 1 0 • 1 • 0 • -3 * Test point (0,0) 0>-02+4(0)-3 0>-3
Homework Page 98 #5-10, 11-16 Page 99 # 34-36