Download
1 / 8
160 likes | 565 Views
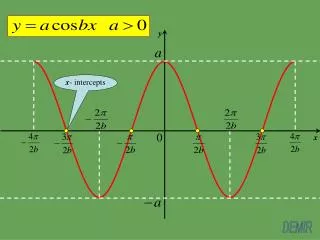
Graphing with X- and Y-Intercepts. Learn to use x- and y-intercepts to graph linear equations. You can graph a linear equation easily by finding the x -intercept and the y -intercept . The x -intercept of a line is the value of x where the line crosses the x -axis (where y = 0).

E N D
Graphing with X- and Y-Intercepts Learn to use x- and y-intercepts to graph linear equations.
You can graph a linear equation easily by finding the x-intercept and the y-intercept. The x-intercept of a line is the value of x where the line crosses the x-axis (where y = 0). The y-intercept of a line is the value of y where the line crosses the y-axis (where x = 0).
Find the x-intercept and y-intercept of the line y = 4x + 4. Use the intercepts to graph the equation. Find the x-intercept (?, 0). y = 4x + 4 Find the y-intercept (0, ?). (0) = 4x + 4 y = 4x + 4 -4 - 4 y = 4(0) + 4 -4 = 4x y = 4 -1 = x The x-intercept is (-1, 0). The y-intercept is (0, 4).
Plot both intercepts on the graph and draw in the line. The graph of y = 4x + 4 is the line that crosses the x-axis at the point (-1, 0) and the y-axis at the point (0, 4).
Find the x-intercept and y-intercept of the line y = -3x - 6. Use the intercepts to graph the equation. Find the x-intercept (?, 0). Find the y-intercept (0, ?). y = -3x - 6 (0) = -3x - 6 y = -3x - 6 +6 _ +6 y = -3(0) - 6 6 = -3x y = -6 -2 = x The x-intercept is (-2, 0). The y-intercept is (0, -6).
Plot both intercepts on the graph and draw in the line. The graph of y = -3x – 6 is the line that crosses the x-axis at the point (-2, 0) and the y-axis at the point (0, –6).
Find the x-intercept and y-intercept of the line y = 18 – 6x. Use the intercepts to graph the equation. Find the x-intercept (?, 0). y = 18 – 6x Find the y-intercept (0, ?). (0)= 18 – 6x y = 18 – 6x 0 = 18 – 6x y = 18 – 6(0) -18 -18 y = 18 -18 = – 6x x = 3 The y-intercept is (0,18). The x-intercept is (3, 0).
Plot both intercepts on the graph and draw in the line. The graph of y = 18 – 6x is the line that crosses the x-axis at the point (3, 0) and the y-axis at the point (0, 18).