Download
1 / 29
290 likes | 304 Views
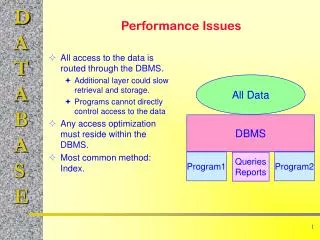
This workshop at BNL in 2009 discussed the performance and issues encountered with the ultrathin carbon ribbon target in Run 9 at RHIC. The presentation covered the goals, strategies, and outcomes of polarization measurements for experiments using the polarimeters, target scan mode, and control of polarization decay. Performance enhancements, new detectors, and system issues were highlighted. While overall upgrades were successful, systematic effects and rate problems were observed, prompting the need for ongoing monitoring and adjustments.

E N D
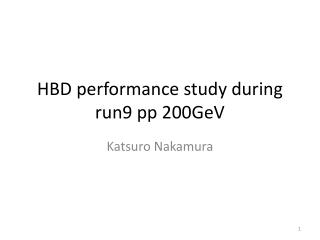
RHIC pCPolarimeters in Run9: Performance and Issues A.Bazilevsky for the RHIC CNI Group PolarimetryWorshop BNL, July 31, 2009
6 1 2 5 3 4 Ultra thin Carbon ribbon Target (5 mg/cm2) pC: goals/strategy 18cm • Polarization measurements for experiments • Target Scan mode • Provides polarization at beam center, polarization profile, average polarization over profile • 10-30 sec per measurement • For stat. precision 2-3% • 4-5 measurements per fill, per ring • Controls polarization decay vs time in a fill • Polarization profile, both vertical and horizontal • Normalized to HJet measurements over many fills • Knowledge on polarization profile in one transverse direction is required • Fill-by-fill polarization • Knowledge on polarization profile in both transverse directions is required • Feedback for accelerator experts • Beam emittance measurements, bunch-by-bunch • Polarization • Polarization profile, both vertical and horizontal • Polarization at injection (and polarization loss in transfer) • Polarization on the ramp (and polarization loss during ramp) Si strip detectors (TOF, EC)
6 1 2 5 3 4 Ultra thin Carbon ribbon Target (5 mg/cm2) pC in Run9 18cm Two independent polarimeters in each ring (but using the same DAQ) 12 carbon targets in each polarimeter (6 vertical and 6 horizontal) 6 detectors in each polarimeter 3 types of detectors: “BNL strip”: 12 strip in each detector Test Detector1: “Hamamatsu strip”: 12 strip in each of 2 900detectors (blue2) Test Detector2:“Hamamatsu single”: 2 pads in each of 2 900 detector (yellow2) Si strip detectors (TOF, EC)
Overall Performance • Great efforts for polarimeter upgrade led by A.Zelenski finished on time by Run9: two independent polarimeters in each ring • Very important precise cross check for pC measurements (comparison to HJet is much less precise) • ~ Simultaneous measurements of polarization profile in both trans. directions • Twice more targets – enough for the half a year long Spin Run • New detectors tested (see talk by B.Morozov) • No major issues/complains from operation by MCR • Smooth performance • … But encountered serious systematic effects
Hjet / pC-Blue vs fill(online values) s=200 GeV HJet/pC ~ Const Within (large) fill-by-fill stat. errors (of HJet)
Hjet / pC-Yellow vs fill(online values) s=200 GeV HJet/pC ~ Const Within (large) fill-by-fill stat. errors (of HJet)
Hjet / pC vs period(online values) Periods defined by target change in any of polarimeters: HJet Again no problems seen on the level of (still sizable) stat. errors
Response to Alphas 241Am: 5.486 MeV Example: Blue1 Feb Apr May Jun Jul On the average, energy calibration (response to alphas) is stable within <2%
Response to Carbon MEtof2 ToF vs E Up to 20% drop in Run9! ~10% drop in Run8
Energy and ToF correction(before Run9) Fit to kinematical curve for C (C-mass) energy correction (in terms of “dead layer”) and t0 correction
“Dead Layer” Run5: 40-55 g/cm2 Run6: 70-80 g/cm2 Run8: 75-90 g/cm2 Run9: 55-75 g/cm2
T0 • ToF offset drifts by ~3-6 ns! • 1 ns change is equivalent to “DeadLayer”~5 g/cm2 • Is it just a fit problem (correlation between “DL” and T0)? • If ~20% change in reconstructed C-mass corresponded to shift in energy scale it would mean ~20% change in asymmetry, which is not confirmed by the comparison with Hjet T0 as measured by the system does drift! • Need to monitor T0 • Simple suggestion (by Gregor Atoyan and Boris Morozov): install photon detector – installed in Run9 but has not been well tested
Rate “problems” s=200 GeV In “banana” cut: Run9-250 GeV: up to 150 kHz/strip Run9-100 GeV: up to 100 kHz/strip Run8-100 GeV: up to 50 kHz/strip Run6-100 GeV: up to 30 kHz/strip Effectively rates are twice higher (in the ToF-Energy window at the entrance of WFD)
pC Monitoring with pulser ToF Generator pulses Blue1 Carbon Ekin
pC Monitoring with pulser Low rate example: 10429.013 20 kHz/strip High rate example: 10346.007 100 kHz/strip Event rate vs time Pulse rate vs time Pulse amplitude vs time Pulse ToF vs time
pC Monitoring with pulser Run 10450.116 110 kHz/strip Pulser Amplitude distribution No Rate High Rate
Rate effects: Mass vs Rate Mass Rate Different correlation patterns not only rate problems (but also T0 drift etc.)
Rate effects: asymmetry vs bunch Low rate case Detector asymmetry is a function of bunch #: Detector (system) performance may vary vs bunch (after abort gap) and vs detector High rate case
Rate effects: Mass vs bunch Low rate case Det 1 Det 3 4% Det 6 Det 4 Bunch dependence of mass Bunch dependence of system performance (energy, tof etc.) High rate case
Pol1 vs Pol2 s=200 GeV 10% variation in the Pol1/Pol2 ratio vs fill (20% variation at s=500 GeV) No obvious correlation with “obvious” observables, such as rate, C-mass
Summary • Upgraded pC polarimeter – many new opportunities • New detectors tested (see talk by B.Morozov) • Crucial cross check from the comparison of Pol1 vs Pol2 • Smooth performance and operation by MCR • Sizable systematic effects observed • Rate effects • “Still unknown” effects • Data analysis ongoing • Expect <10% (<20%) uncertainty in pol. measurements for 100 GeV (250 GeV) beams in Run9 • Considering substantial system modification • Better (thinner and uniform) target production (see talk by A.Zelenski) • More robust detectors, smaller acceptance (see talk by B.Morozov) • Faster preamps • Replace WFD with simple ADC/TDC scheme?
Rate Run9-250GeV (per 48 strip) Run9-100GeV (per 48 strip) Run6 (per 72 strip) Run8 (per 72 strip)
C-mass Run9-250GeV Run9-100GeV Run8