Download
1 / 72
720 likes | 733 Views
Explore data mining in gene expression for disease diagnosis and understanding. Gain insights into gene interactions, treatment plans, and more. Discover the significance of protein interactions and the impact on diagnosis and cures.

E N D
Data Mining of Gene Expression Profiles for the Diagnosis and Understanding of Diseases Limsoon Wong Institute for Infocomm Research
Plan • Some accomplishments and challenges in knowledge discovery from biological and clinical data • Data mining in microarray analysis • diagnosis of disease state and subtype • derivation of treatment plan • understanding of gene interaction network
Knowledge Discovery from Biological and Clinical Data: MOTIVATION
Complete genomes are now available • Knowing the genes is not enough to understand how biology functions • Proteins, not genes, are responsible for many cellular activities • Proteins function by interacting with other proteins and biomolecules INTERACTOME GENOME PROTEOME Driving Forces: Genes, Proteins, Interactions, Diagnosis, & Cures
If we figure out how these work, we get these Benefits • To the patient: • Better drug, better treatment • To the pharma: • Save time, save cost, make more $ • To the scientist: • Better science
To figure these out,we bet on... “solution” = Data Mgmt + Knowledge Discovery Data Mgmt = Integration + Transformation + Cleansing Knowledge Discovery = Statistics + Algorithms + Databases
Knowledge Discovery from Biological and Clinical Data: ACCOMPLISHMENT
Protein Interactions Extraction (PIES) MHC-Peptide Binding (PREDICT) Gene Expression & Medical Record Datamining (PCL) Molecular Connections Cleansing & Warehousing (FIMM) Integration Technology (Kleisli) Gene Feature Recognition (Dragon) Venom Informatics Biobase GeneticXchange 1994 1996 1998 2002 2000 ISS LIT/I2R KRDL 8 years of bioinformatics R&D in Singapore
Vaccines are often the only solution for viral diseases Finding & developing effective vaccine targets is slow and expensive process • Develop systems to recognize • protein peptides that bind • MHC molecules • Develop systems to recognize • hot spots in viral antigens Predict Epitopes,Find Vaccine Targets
Effective recognition of initiation, control, and termination of biological processes is crucial to speeding up and focusing scientific experiments Data mining of bio seqs to find rules for recognizing & understanding functional sites Recognize Functional Sites,Help Scientists Dragon’s 10x reduction of TSS recognition false positives
Diagnose Leukaemia, Benefit Children • Childhood leukaemia is a heterogeneous disease • Treatment is based on subtype • 3 different tests and 4 different experts are needed for accurate diagnosis • Curable in USA, • fatal in Indonesia • A single platform diagnosis • based on gene expression • Data mining to discover • rules that are easy for • doctors to understand
Understand Proteins,Fight Diseases • Understanding function and role of protein needs organised info on interaction pathways • Such info are often reported in scientific paper but are seldom found in structured databases • Knowledge extraction • system to process free text • extract protein names • extract interactions Jak1
What’s a Microarray? • Contain large number of DNA molecules spotted on glass slides, nylon membranes, or silicon wafers • Measure expression of thousands of genes simultaneously
quartz is washed to ensure uniform hydroxylation across its surface and to attach linker molecules exposed linkers become deprotected and are available for nucleotide coupling Making Affymetrix GeneChip
Data Mining in Microarray Analysis: DISEASE SUBSTYPE DIAGNOSIS
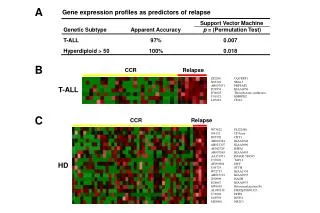
Pediatric Acute Lymphoblastic Leukemia • A heterogeneous disease with more than 12 subtypes, e.g., T-ALL, E2A-PBX1, TEL-AML1, BCR-ABL, MLL, and Hyperdip>50. • Treatment response is subtype dependent • 80% continuous remission if subtype is correctly diagnosed and the corresponding treatment plan is applied
Subtype Diagnosis • Require different tests: • immunophenotyping • cytogenetics • molecular diagnostics • Require different experts: • hematologist • oncologist • pathologist • cytogeneticist
Difficulties and Implications • The different tests and experts are not commonly available within a single hospital, especially in less advanced countries • An 80%-curable disease in USA can be a fatal disease in Indonesia! • Is there a single diagnostic platform that does not need multiple human specialists?
BCR-ABL Hyperdiploid >50 T-ALL MLL Novel Diagnostic ALL BM samples (n=327) E2A-PBX1 TEL-AML1 Genes for class distinction (n=271) E2A-PBX1 MLL T-ALL Hyperdiploid >50 BCR-ABL Novel TEL-AML1 3 -1 1 -3 -2 2 0 = std deviation from mean A Potential Solution by MicroarraysYeoh et al., Cancer Cell 1:133--143, 2002
Some Caveats • Study was performed on Americans • May not be applicable to Singaporeans, Malaysians, Indonesians, etc. • Large-scale study on local populations currently in the works
Typical Procedure in Analysing Gene Expression for Diagnosis • Gene expression data collection • Gene selection • Classifier training • Classifier tuning (optional for some machine learning methods) • Apply classifier for diagnosis of future cases
Feature Selection Methods A refresher of feature selection methods
Signal Selection (Basic Idea) • Choose a signal w/ low intra-class distance • Choose a signal w/ high inter-class distance
Signal Selection (eg., CFS) • Instead of scoring individual signals, how about scoring a group of signals as a whole? • CFS • Correlation-based Feature Selection • A good group contains signals that are highly correlated with the class, and yet uncorrelated with each other
Gene Expression Profile Classification An introduction to gene expression profile classification by the example on ALL subtype diagnosis
Subtype Classification of ALL A tree-structured diagnostic workflow was recommended by the doctors, as per Yeoh et al., Cancer Cell 1:133--143, 2002
Our procedure for ALL subtype diagnosis • Gene expression data collection • Gene selection by entropy • Classifier training by emerging pattern • Classifier tuning (optional for some machine learning methods) • Apply classifier for diagnosis of future cases by PCL
Emerging Patterns (EPs) • An EP is a set of conditions • usually involving several features • that most members of a class satisfy • but none or few of the other class satisfy • A jumping EP is an EP that • some members of a class satisfy • but no members of the other class satisfy • We use only most general jumping EPs
PCL 0:1 0:2 0:1 0:1 1:1 1:1 1:1 2:2 1:1 0:0 1:6 0:2 4 14 5 7 5 Accuracy (using 20 genes of lowest entropy)
Gene Expression Profile ClassificationHow about other feature selection and classification methods?
Some gene selection heuristics • all-CFS: all features from CFS • top20-2: 20 features w/ highest 2 stats • top20-t: 20 features w/ highest t-stats • top20-mit: 20 features w/ highest MIT stats • entropy: 20 features w/ lowest entropy • all-2: all features meeting 5% significance level of 2 stats
Some other classification methods • k-NN (k=1) • majority votes of the k nearest neighbours determined by Euclidean distance • C4.5 • widely used decision tree method. • Naïve Bayes (NB) • probabilistic prediction using Bayes’ rule • SVM • (linear) discriminant function that maximizes separation of boundary samples
Accuracy • Feature selection improves performance • Entropy+PCL has consistent high performance
When 20 genes are selected randomly Average over 100 experiments Cf. 7-15 mistakes total with good feature selection
Data Mining in Microarray Analysis: TREATMENT PLAN DERIVATION A pure speculation!
Can we do more with EPs? • Detect gene groups that are significantly related to a disease • Derive coordinated gene expression patterns from these groups • Derive “treatment plan” based on these patterns
Colon Tumour DatasetAlon et al., PNAS 96:6745--6750, 1999 • We use the colon tumour dataset above to illustrate our ideas • 22 normal samples • 40 colon tumour samples
Detect Gene Groups • Feature Selection • Use entropy method • 35 genes have cut points • Generate EPs • 19501 EPs in normals • 2165 EPs in tumours • EPs with largest support are gene groups significantly co-related to disease
Some EPs contain large number of genes and still have high freq E.g., {2, 3, 6, 7, 13, 17, 33} has freq 90.91% in normal and 0% in cancer samples Nearly all normal sample’s gene expr. values satisfy all conds. implied by these 7 items Observation 1