Download

1 / 44
490 likes | 736 Views
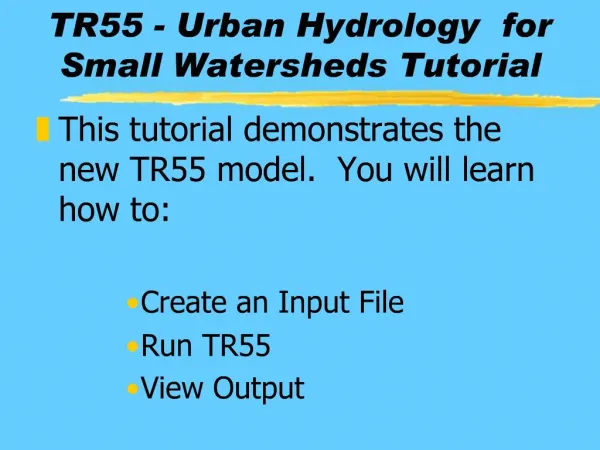
TR-55 Urban Hydrology for Small Watersheds Tutorial. Karl K. Visser Hydraulic Engineer Champaign, IL. Tutorial. Demonstrate Windows TR-55 Create TR-55 Input File Run TR-55 View TR-55 Output. Maximum Area 25 square miles Number of Watersheds 1-10

E N D
TR-55Urban Hydrology for Small Watersheds Tutorial Karl K. VisserHydraulic EngineerChampaign, IL
Tutorial • Demonstrate Windows TR-55 • Create TR-55 Input File • Run TR-55 • View TR-55 Output TR-55 Tutorial
Maximum Area 25 square miles Number of Watersheds 1-10 Tc for any sub-area 0.1 hour <Tc < 10 hours Number of reaches 0-10 Types of reaches Channel or Structure Reach Routing Muskingum-Cunge Structure Routing Storage-Indication Structure Types Pipe or Weir Structure Trial Sizes 1-3 Rainfall Depth Default or user-defined 0-50 inches (0-1,270 mm) TR-55 Capabilities & Limitations TR-55 Tutorial
Rainfall Distributions NRCS Type I,IA,II,III, or user-defined Rainfall Duration 24-hour Dimensionless Unit Standard peak rate Hydrograph 484 or user-defined Antecedent Moisture Condition 2 (average) Capabilities & Limitations TR-55 Tutorial
Minimum Data Requirements • Single sub-area run data • TR-55 Main Window: • Identification Data - User, State, and County • Dimensionless Unit Hydrograph • Rainfall Storm Data • Sub-area Data (Name, flows to reach/outlet, area, runoff curve number, & time of concentration) TR-55 Tutorial
TR-55 Sub-area/Reach Concepts • Watershed - system of sub-areas and reaches. • Sub-areas - watersheds that generate hydrographs • Sub-areas-feed into the upstream end of a stream reach TR-55 Tutorial
TR-55 Sub-area/Reach Concepts • Reaches - represent watershed stream flow paths • Reaches or Routing Elements - 2 types • Channel routing elements - Stream Reach • Storage routing elements - Reservoir/Structure Reach • “Outlet” -final reach(required for all watersheds) TR-55 Tutorial
Sub-area 2 Reach 2 Outlet (ReachRouting) Reach 1(storage routing) Sub-area 3 Sub-area 1 Legend Storage Area Sub-Area Inflow Points Schematic Example TR-55 Tutorial
Sub-area Data Sources • The sub-area data compiled prior to input into TR-55 include: • Drainage Area • Runoff Curve Number (RCN) Data • Time of Concentration (Tc) Data • Channel Reach Data • Structure Reach Data • Design Storm Amounts and Distribution NOTE: RCN and Tc may be directly entered on TR-55 Main Window TR-55 Tutorial
Getting Started- Welcome to TR-55 Window • From Windows Explorer click on “WinTR-55.exe” • “Return to TR55” start TR-55 • “New User?” new user help • Skip welcome screen option TR-55 Tutorial
TR-55 Main Window • Input basic project data • Menu • Buttons • Input boxes TR-55 Tutorial
TR-55 Main Window-Help • Displays introduction • Help for the Main Window • System information • Program version number and date TR-55 Tutorial
TR-55 Main Window • New project “File” “New” TR-55 Tutorial
TR-55 Main Window • Set units • English or Metric • “Options” “Units” TR-55 Tutorial
TR-55 Main Window • Save input file before: • Computing TR-55 results • Exiting the TR-55 program • File-Savesave with current file name • File-Save Assave with different name TR-55 Tutorial
TR-55 Main Window-Data Entry • Input Project Identification Data (User, Project, etc.) • Choose area units • square mile or acres • square km or hectares • Select Dimensionless Unit Hydrograph • Input known project data in the “Sub-area Entry and Summary” portion of the window • Tc & RCN can be direct input TR-55 Tutorial
TR-55 Main Window-Project Data • Project Data • Land Use Details • Time of Concentration • Structure Data • Reach Data • Project Data menu • Buttons • Double-click appropriate title blocks in grid TR-55 Tutorial
Land Use Details Window • Find appropriate land use • right vertical scrollbar • select Land Use Category radio button • Enter area in correct hydrologic soil column • Maximum 15 land uses per subarea TR-55 Tutorial
Land Use Details Window • Weighted CN • Accumulated sub-area area TR-55 Tutorial
Land Use Summary • Convenient summary • Displays all Land Uses in current subarea • Summary toggle TR-55 Tutorial
Custom Curve Number • If standard Cover Descriptions do not apply • Create a Custom CN to fit specific land cover • Pervious area curve number • % Impervious area • % Impervious area unconnected TR-55 Tutorial
Time of Concentration Details Window • Enter sub-area flow path segment data • 5 flow segments: 1-sheet flow 2-shallow concentrated2-channel flow • Displays total flow path length • Displays average flow velocity TR-55 Tutorial
Reach Data Window • Edit stream network • Specify channel reach or storage (structure) reach • Create channel reach rating table • Use another model (e.g. NRCS TR-20) when: • > 10 reaches • complex channel or storage routing TR-55 Tutorial
Reach Data Window • Enter unique “Reach Name” (< 10 characters) • Enter downstream “Receiving Reach” • Channels - enter channel data • Structure - enter structure name, then double-click the Structure Name to display the Structure Data Window. TR-55 Tutorial
Reach Data Window • Click “Plot” for graphical channel rating • Options for line width and color TR-55 Tutorial
Reach Data Window • Click “Reach Flow Path” for schematic • Detail toggle All Details Overview TR-55 Tutorial
Structure Data Window • Edit: structure namepond surface areaoutlet type (pipe or weir)outlet dimensions • Structure name correspond to Reach Window name • Up to three outlet sizes (trials) • More complex ratings--use another model (e.g.TR-20 or Sites) TR-55 Tutorial
TR-55 Main Window-GlobalData • Storm Data-rainfall depths(how much did it rain?) • Custom Rainfall Distributions-(how was the rain distributed during the storm?) • Dimensionless Unit Hydrograph-(What shape is the hydrograph?) TR-55 Tutorial
Storm Data Window • Choose NRCS-supplied rainfall depths and distributions for the US states and counties • Edit rainfall depths • Select design rainfall distribution • Click “Accept” • Changing State-County on Main Window doesn’t change Storm Data! • Set/edit Storm Data each run! TR-55 Tutorial
Watersheds Outside US • “State” and “County” become“Region” and “Locale” • No NRCS-supplied rainfall data • User must enter rainfall depths and the appropriate distribution TR-55 Tutorial
Custom Rainfall Distributions • Create new distribution • TR-55 Main Window “GlobalData” menu “Custom Rainfall Distribution” or “Custom Rainfall Distribution” button • Rename/delete distribution • Enter dimensionless distribution(increase from 0.00000 to 1.00000) • Displays time increment and number of points TR-55 Tutorial
Custom Rainfall Distributions Plot • “Plot” of current rainfall distribution • One distribution plot(no comparisons) • Options for line width and color TR-55 Tutorial
Dimensionless Unit Hydrographs Window • Edit new dimensionless unit hydrograph • Rename/delete dimensionless unit hydrograph • Values increase from 0-1,then decrease 1-0 • Number of points displayed • Standard NRCS dimensionless unit hydrographs in TR-55 may not be edited or deleted TR-55 Tutorial
Dimensionless Unit Hydrograph Plot • “Plot” button on the Dimensionless Unit Hydrographs window • Options for line width and color • Single DUH(no multiple DUH plots) TR-55 Tutorial
TR-55 Main Window-Run • ”Run” on the TR-55 Main Window menu or“Run” button • Check storm(s) to evaluate • Click “Run” button • “Run” not available for incomplete data TR-55 Tutorial
Viewing Output • File Display window opens after TR-55 run • Also known as Report View • Displays various TR-55 reports • Errors during run - “Error File” window opens • Also open error messages click “View”then “Error File” TR-55 Tutorial
Output Definition Window • Complete data for a run“Output Definition” button available (TR-55 Main Window) • Check desired output report • Print to printer • View on-screen TR-55 Tutorial
Possible TR-55 Reports • Current data description • Storm Data • Watershed Peak Table • Hydrograph Peak/Peak Time Table • Structure Output Table • Reach Summary Table • Sub-Area Time of Concentration Details • Sub-Area Land Use and Curve Number Details • Reach Channel Rating Details • Structure Rating Details TR-55 Tutorial
Other Reports • File Display window (report viewer) • Input file • TR-20 Printed Page file(tabular hydrograph) • Debug file • Error file TR-55 Tutorial
Plotting and Viewing Hydrographs • Click Hydrographs button(Main TR-55 Window) • Select Sub-areas or Reaches • Check desired subareas or desired reaches • Check storm event • Check alternatives TR-55 Tutorial
Graphics Window • Click “Plot” on the Output Graphics window to plot selected hydrographs • Options for line width and color • Multiple hydrographs • Print to printer or • Save bitmap image TR-55 Tutorial
TR-55 Web Site • Download latest TR-55 version http://www.wcc.nrcs.usda.gov/water/quality/wst.html • Update notes • TR-55 User Manual • TR-55 Support Team e-mail address TR-55 Tutorial
Summary • Demonstrated Windows TR-55 • Created TR-55 Input File • Ran TR-55 • Viewed TR-55 Output TR-55 Tutorial
Development Team TR-55 Tutorial