Download
1 / 93
930 likes | 964 Views
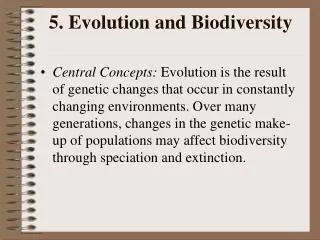
Explore how evolution shapes biodiversity, the impact of speciation and extinction, the dynamics of populations and communities, and conservation challenges. Learn about natural selection through a fascinating case study and understand the evidence and mechanisms behind it. Discover how speciation leads to Earth's species richness and the evolutionary processes that drive biological diversity.

E N D
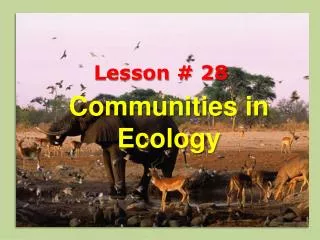
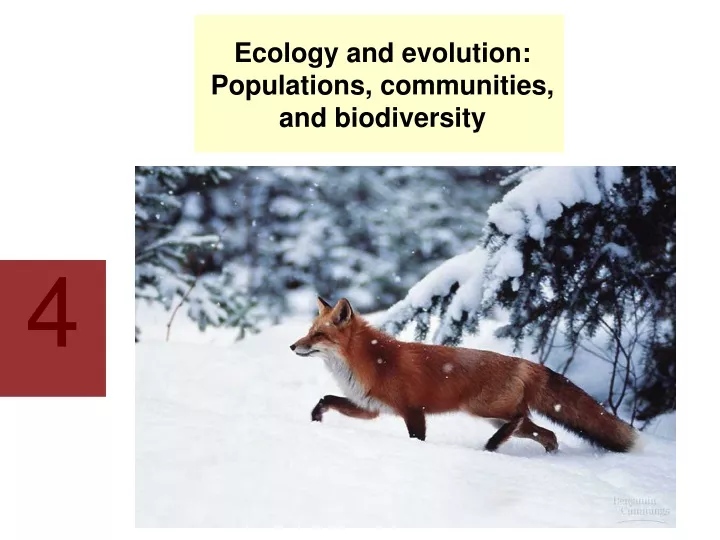
4 Ecology and evolution: Populations, communities, and biodiversity
This lecture will help you understand: • How evolution generates biodiversity • Speciation, extinction, and the “biodiversity crisis” • Population ecology • Community ecology • Species interactions • Conservation challenges • Evolution by natural selection
Central Case: Striking Gold in a Costa Rican Cloud Forest • The golden toad of Monteverde, discovered in 1964, had disappeared 25 years later. • Researchers determined that warming and drying of the forest was most likely responsible for its extinction. • As the global climate changes, more such events can be expected.
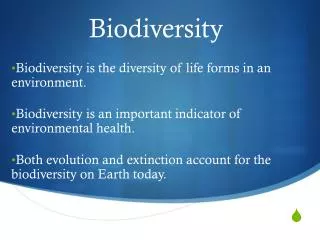
Biodiversity Biodiversity, or biological diversity, is the sum of an area’s organisms, considering the diversity of species, their genes, their populations, and their communities. A species is a particular type of organism; a population or group of populations whose members share certain characteristics and can freely breed with one another and produce fertile offspring.
Biodiversity • Costa Rica’s Monteverde cloud forest is home to many species and possesses great biodiversity. Figure 5.1
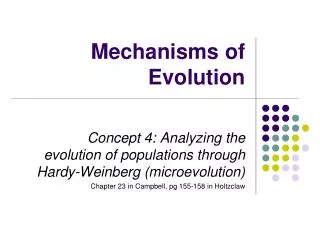
Natural selection • Natural selection rests on three indisputable facts: • • Organisms produce more offspring than can survive. • • Individuals vary in their characteristics. • • Many characteristics are inherited by offspring from parents.
THEREFORE, logically… • Some individuals will be better suited to their environment; they will survive and reproduce more successfully. • These individuals will transmit more genes to future generations. • Future generations will thus contain more genes from better-suited individuals. • Thus, characteristics will evolve over time to resemble those of the better-suited ancestors. Natural selection
Natural selection • Fitness = the likelihood that an individual will reproduce • and/or • the number of offspring an individual produces over its lifetime • Adaptive trait, • oradaptation = a trait that increases an individual’s fitness
Natural selection • Evidence of natural selection is all around us: • In nature … • Diverse bills have evolved among species of Hawaiian honeycreepers. Figure 4.23a
Fruit and seed eaters Insect and nectar eaters Greater Koa-finch Kuai Akialoa Amakihi Kona Grosbeak Crested Honeycreeper Akiapolaau Apapane Maui Parrotbill Unknown finch ancestor Beak Types Resulting From Natural Selection
Natural selection • Evidence of natural selection is all around us: • … and in our domesticated organisms. Dog breeds, types of cattle, improved crop plants—all result from artificial selection (natural selection conducted by human breeders). Figure 4.23b
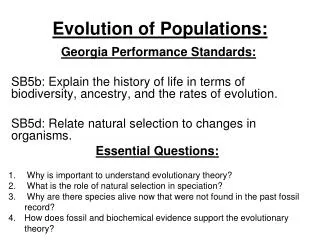
Speciation • The process by which new species come into being • Speciation is an evolutionary process that has given Earth its current species richness—more than 1.5 million described species and likely many million more not yet described by science. • Allopatric speciation is considered the dominant mode of speciation, and sympatric speciation also occurs.
Allopatric speciation 1. Single interbreeding population 2. Population divided by a barrier; subpopulations isolated Figure 5.2
Allopatric speciation • 3. The two populations evolve independently, diverge in their traits. • 4. Populations reunited when barrier removed, but are now different enough that they don’t interbreed. Figure 5.2
Allopatric speciation • Many geological and climatic events can serve as barriers separating populations and causing speciation. on.
Chemical Evolution (1 billion years) Formation of the earth’s early crust and atmosphere Small organic molecules form in the seas Large organic molecules (biopolymers) form in the seas First protocells form in the seas Biological Evolution (3.7 billion years) Single-cell prokaryotes form in the seas Single-cell eukaryotes form in the seas Variety of multicellular organisms form, first in the seas and later on land
Arctic Fox Northernpopulation Spreads northward and southward and separates Adapted to cold through heavier fur, short ears, short legs, short nose. White fur matches snow for camouflage. Different environmental conditions lead to different selective pressures and evolution into two different species. Early fox population Southernpopulation Gray Fox Adapted to heat through lightweight fur and long ears, legs, and nose, which give off more heat. Geographic Separation
Bombardier beetle Span worm Wandering leaf insect Foul-tasting monarch butterfly When touched, the snake caterpillar changes shape to look like the head of a snake Poison dart frog Viceroy butterfly mimics monarch butterfly Hind wings of io moth resemble eyes of a much larger animal Mimicry
Phylogenetic trees • Life’s diversification results from countless speciation events over vast spans of time. • Evolutionary history of divergence is shown with diagrams called phylogenetic trees. • Similar to family genealogies, these show relationships among organisms.
Phylogenetic trees These trees are constructed by analyzing patterns of similarity among present-day organisms. This tree shows all of life’s major groups. Figure 5.4
Phylogenetic trees Within the group Animals in the previous slide, one can infer a tree of the major animal groups. Figure 5.4
Phylogenetic trees And within the group Vertebrates in the previous slide, one can infer relationships of the major vertebrate groups, and so on… Figure 5.4
Extinction • Extinction is the disappearance of an entire species from the face of the Earth. • Average time for a species on Earth is ~1–10 million years.Species currently on Earth = the number formed by speciation minus the number removed by extinction.
Extinction • Some species are more vulnerable to extinction than others: • • Species in small populations • • Species adapted to a narrowly specialized resource or way of life • Monteverde’s golden toad was apparently such a specialist, and lived in small numbers in a small area.
Extinction • Some species are more vulnerable to extinction than others: • • Species in small populations • • Species adapted to a narrowly specialized resource or way of life • Monteverde’s golden toad was apparently such a specialist, and lived in small numbers in a small area.
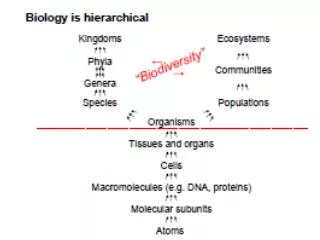
Life’s hierarchy of levels • Life occurs in levels: • from the atom up to • the molecule to • the cell to • the tissues to • the organs to • the organism… Figure 5.7
Life’s hierarchy of levels • … and from the organism to the population to • the community to • the ecosystem to • the biosphere. • Ecology deals with these levels, from the organism up to the biosphere. Figure 5.7
Ecology • The study of: • the distribution and abundance of organisms, • the interactions among them, • and the interactions between organisms and their abiotic environments • Ecology is NOT environmental advocacy! • (= a common MISUSE of the term)
Habitat and niche • Habitat = the specific environment where an organism lives (including living and nonliving elements: rocks, soil, plants, etc.) • Habitat selection = the process by which organisms choose habitats among the options encountered • Niche = an organism’s functional role in a community (feeding, flow of energy and matter, interactions with other organisms, etc.)
Population ecology • Population = a group of individuals of a species that live in a particular area • Several attributes help predict population dynamics (changes in population): • • Population size • • Population density • • Population distribution • • Age structure • • Sex ratio
Population size • Number of individuals present at a given timePopulation size for the golden toad was 1,500+ in 1987, and zero a few years later.
Population density • Number of individuals per unit area or, • Number of individuals per unit volume • Population density for the harlequin frog increased locally as streams dried and frogs clustered in splash zones.
Population distribution • Spatial arrangement of individuals Clumped Random Uniform Figure 5.8
Age structure • Or age distribution = relative numbers of individuals of each age or age class in a population • Age structure diagrams, or age pyramids, show this information. Figure 5.9
Age structure Pyramid weighted toward young: population growing Pyramid weighted toward old: population declining Figure 5.9
Sex ratio • Ratio of males to females in a population • Even ratios (near 50/50) are most common. • Fewer females causes slower population growth. • Note human sex ratio biased toward females at oldest ages.
Population growth Populations grow, shrink, or remain stable, depending on rates of birth, death, immigration, and emigration. (birth rate + immigration rate) – (death rate + emigration rate) = population growth rate
Exponential growth • Unregulated populations increase by exponential growth: • Growth by a fixed percentage, rather than a fixed amount. • Similar to growth of money in a savings account
Exponential growth in a growth curve • Population growth curves show change in population size over time. • Scots pine shows exponential growth Figure 5.10
Limits on growth • Limiting factors restrain exponential population growth, slowing the growth rate down. • Population growth levels off at a carrying capacity—the maximum population size of a given species an environment can sustain. • Initial exponential growth, slowing, and stabilizing at carrying capacity is shown by a logistic growth curve.
Logistic growth curve Figure 5.11
Population growth: Logistic growth • Logistic growth (shown here in yeast from the lab) is only one type of growth curve, however. Figure 5.12a
Population growth: Oscillations • Some populations fluctuate continually above and below carrying capacity, as with this mite. Figure 5.12b
Population growth: Dampening oscillations • In some populations, oscillations dampen, as population size settles toward carrying capacity, as with this beetle. Figure 5.12c
Population growth: Crashes • Some populations that rise too fast and deplete resources may then crash, as with reindeer on St. Paul Island. Figure 5.12d
Density dependence • Often, survival or reproduction lessens as populations become more dense. • Density-dependent factors (disease, predation, etc.) account for the logistic growth curve.
Biotic potential and reproductive strategies Species differ in strategies for producing young. Species producing lots of young (insects, fish, frogs, plants) have high biotic potential. Others, such as mammals and birds, produce few young. However, those with few young give them more care, resulting in better survival.
POPULATION SIZE Growth factors (biotic potential) Decrease factors (environmental resistance) Abiotic Abiotic Too much or too little light Temperature too high or too low Unfavorable chemical environment (too much or too little of critical nutrients) Favorable light Favorable temperature Favorable chemical environment (optimal level of critical nutrients) Biotic Biotic High reproductive rate Generalized niche Adequate food supply Suitable habitat Ability to compete for resources Ability to hide from or defend against predators Ability to resist diseases and parasites Ability to migrate and live in other habitats Ability to adapt to environmental change Low reproductive rate Specialized niche Inadequate food supply Unsuitable or destroyed habitat Too many competitors Insufficient ability to hide from or defend against predators Inability to resist diseases and parasites Inability to migrate and live in other habitats Inability to adapt to environmental change Biotic Potential
Late loss 100 Constant loss 10 Percentage surviving (log scale) 1 0 Early loss Age Survivorship
K-Selected Species Saguaro Elephant Fewer, larger offspring High parental care and protection of offspring Later reproductive age Most offspring survive to reproductive age Larger adults Adapted to stable climate and environmental conditions Lower population growth rate (r) Population size fairly stable and usually close to carrying capacity (K) Specialist niche High ability to compete Late successional species K-strategists Terms come from: K = symbol for carrying capacity. (Populations tend to stabilize near K.)