Download
1 / 17
170 likes | 224 Views
Explore concepts of statistical inference, central limit theorem, and sampling distribution of means. Learn how to infer characteristics of populations from samples. Understand how to calculate and interpret sampling distributions. Analyze hypothetical scenarios and probabilities in population sampling methods.

E N D
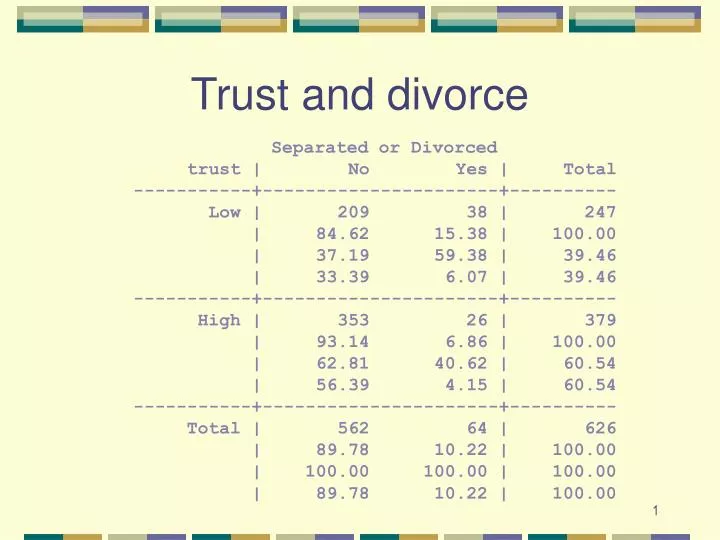
Trust and divorce Separated or Divorced trust | No Yes | Total -----------+----------------------+---------- Low | 209 38 | 247 | 84.62 15.38 | 100.00 | 37.19 59.38 | 39.46 | 33.39 6.07 | 39.46 -----------+----------------------+---------- High | 353 26 | 379 | 93.14 6.86 | 100.00 | 62.81 40.62 | 60.54 | 56.39 4.15 | 60.54 -----------+----------------------+---------- Total | 562 64 | 626 | 89.78 10.22 | 100.00 | 100.00 100.00 | 100.00 | 89.78 10.22 | 100.00
Love and divorce | Separated or Divorced love | No Yes | Total -----------+----------------------+---------- Low | 236 30 | 266 | 88.72 11.28 | 100.00 | 41.99 46.88 | 42.49 | 37.70 4.79 | 42.49 -----------+----------------------+---------- High | 326 34 | 360 | 90.56 9.44 | 100.00 | 58.01 53.12 | 57.51 | 52.08 5.43 | 57.51 -----------+----------------------+---------- Total | 562 64 | 626 | 89.78 10.22 | 100.00 | 100.00 100.00 | 100.00 | 89.78 10.22 | 100.00
Statistical Inference • Using samples to infer characteristics about populations • What inferences? Primarily means and proportions • Means and proportions indicate central tendencies of important characteristics
Central Limit Theorem • Know the sampling distribution of means from properties of the population • Mean of sampling distribution of means is mean of the population • Standard deviation of sampling distribution of means is times sd of population • Sampling distribution is normal
Sampling Distribution of Means • Take a random sample of size n from a population with any distribution • Calculate the mean of the sample • Record the mean • Repeat infinitely, recording all means and making a distribution of the means • This is a sampling distribution of means
Sampling distribution of means 95% Pop mean Size of Sampling Distribution sd
A Sample Mean = 23.7 Standard Deviation = 3 n = 900 What kind of population could this sample have come from? Population mean = 22? Population mean = 23? Population mean = 24? Population mean = 25?
If population mean is 22 • What is population standard deviation? • We don’t know • Use sample information to answer this • How calculate sample sd?
If pop mean=22, sd=3, n=900 • Central Limit Theorem says • Sampling distribution mean will be 23 • Sampling distribution sd = 3 / 30 = .1 • 95% of all samples will have mean of 22 ± 2 * .1 Thus, the range from 21.8 - 22.2 will contain 95% of sample means.
If pop mean=23, sd=3, n=900 • Central Limit Theorem says • Sampling distribution mean will be 23 • Sampling distribution sd = 3 / 30 = .1 • 95% of all samples will have mean of 23 ± 2 * .1 Thus, the range from 22.8 - 23.2 will contain 95% of sample means.
If pop mean=24, sd=3, n=900 • Central Limit Theorem says • Sampling distribution mean will be 24 • Sampling distribution sd = 3 / 30 = .1 • 95% of all samples will have mean of 24 ± 2 * .1 Thus, the range from 23.8 - 24.2 will contain 95% of sample means.
Look at each of these • Pop mean 22, sd 3 ==> 21.8 - 22.2 • Pop mean 23, sd 3 ==> 22.8 - 23.2 • Pop mean 24, sd 3 ==> 23.8 - 24.2 • Pop mean 25, sd 3 ==> 24.8 - 25.2 • Our sample mean is 23.7 -- an unlikely event from any above hypothesis.
Pop mean=24, sd=3, n=900 Sampling Distribution 95% 23.7 23.8 23.9 24 24.1 24.2 Our Sample
Conventions • An unlikely event is one that occurs less than 1 / 20 that is, has a probability less than .05 • An unlikely event is one that occurs less than 1 /100, or p < .01 • An unlikely event is one that occurs less than 1/1000, or p < .001
Which convention to use? • Answer depends upon risks of being wrong. • What are the consequences of deciding men do not earn more than women? • What are the consequences of deciding a drug has no side effects? • What are the consequences of deciding the “greenhouse” gases have no effect on the earth’s temperature?
Two kinds of risk • Fail to reject a hypothesis that is false • Reject a hypothesis that is true • The only one that we have real control over is the probability of rejecting a hypothesis that is, in fact, true • Let’s look at this one
Pop mean=24, sd=3, n=900 Sampling Distribution 95% 23.7 23.8 23.9 24 24.1 24.2 Our Sample