Download
1 / 25
250 likes | 520 Views
Epidemiology of TBI. Alexandra Brazinova, MD, MPH, PhD IGEH seminar Oct.28,2003. Traumatic brain injury. “of all types of injury, those to the brain are among the most likely to result in death or permanent disability”

E N D
Epidemiology of TBI Alexandra Brazinova, MD, MPH, PhD IGEH seminar Oct.28,2003
Traumatic brain injury • “of all types of injury, those to the brain are among the most likely to result in death or permanent disability” • Estimates of TBI incidence, severity and cost = enormous losses to individuals, families and society www.neuroskills.com (USA – rehabilitation centers)
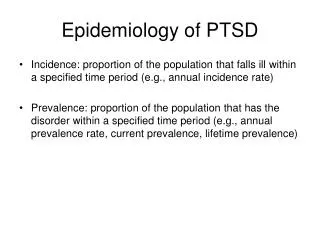
What does epidemiology follow in TBI • Causes, mechanisms, severity • Prevalence (morbidity)– total no. of cases at any given time and certain area • Incidence – new cases at certain time in certain area (country, etc.) • Mortality • Health outcomes
Causes, mechanisms, severity Causes & mechanisms: • MVAs – leading cause of TBIs • Falls – second leading cause • Work-related TBIs • Firearms Alcohol – major factor in many TBIs Severity: mild, moderate, severe
Prevalence • is not well documented, because mild cases may not be hospitalized. Estimates are often based on existing disabilities • Discrepancies in data collection : difference in findings of diagnostic imaging at different time intervals
Incidence of TBI (US) • Mild TBI - 131 cases per 100,000 people • Moderate TBI – 15 cases per 100,000 • Severe TBI – 14 cases per 100,000 (with prehospital deaths included – 21 cases)
High-risk population • Young people • Low-income individuals • Single individuals • Members of ethnic minority groups • Residents of inner cities • Men • Individuals with previous history of substance abuse • Individuals with previous TBI
Health outcomes – impairments/disabilities resulting from TBI • Cognition – concentration, memory, judgment, mood • Movement abilities – strength, coordination, balance • Sensation – tactile, vision, etc. • Seizure disorders (epilepsy) • Persisting unconsciousness
TBI related mortality rate (US) • Deaths outside the hospital – 17 per 100,000 people • Hospitalized patients – 6 per 100,000 • 33% in severe TBI, 2.5% in mild TBI
Abstracts • Epilepsia. 2003;44 Suppl 10:2-10. The epidemiology of traumatic brain injury: a review.Bruns J, Hauser WA.Neurology Sergievsky Center, College of Physicians and Surgeons Department of Epidemiology, Joseph L. Mailman School of Public Health, Columbia University Department of Emergency Medicine, Mt. Sinai School of Medicine, New York, New York, U.S.A. Review of studies of TBI: incidence of TBI in the US is 180-250 per 100,000, higher in Europe and South Africa. Groups at high risk – males in regions with socioeconomic deprivation.
Abstracts • Brain Inj. 1997 Sep;11(9):649-59. Epidemiology of traumatic brain injury in South Australia.Hillier SL, Hiller JE, Metzer J.Department of Community Medicine, University of Adelaide, South Australia.Incidence 322 per 100,000 (exceeds studies in Europe and US). Highest risk population: young males living in the country and working in manual trades. Hospitals in this state have more than 4000 new cases of TBI each year.
Abstracts • J Neurosurg Sci. 2002 Dec;46(3-4):111-9. Regional brain injury epidemiology as the basis for planning brain injury treatment. The Romagna (Italy) experience.Servadei F, Antonelli V, Betti L, Chieregato A, Fainardi E, Gardini E, Giuliani G, Salizzato L, Kraus JF.Incidence rate 250 per 100,000. External causes of injury are similar to Western Europe, except very low frequency of cases from violence.
Abstracts • Acta Neurol Scand. 2003 Apr;107(4):256-9. Epidemiology of traumatic brain injury: a population based study in western Sweden.Andersson EH, Bjorklund R, Emanuelson I, Stalhammar D.Department of Rehabilitation Medicine, Central Hospital Boras, SE 501 82 Boras, Sweden. elisabeth.Andersson@vgregion.seIncidence of 546 per 100,000. The external causes were dominated by fall from same level (31%) and fall from different level (27%) followed by traffic accidents (16%) and persons hit by objects (15%).
Abstracts • MMWR Surveill Summ. 2003 Jun 27;52(4):1-20. Traumatic brain injury-related hospital discharges. Results from a 14-state surveillance system, 1997.Langlois JA, Kegler SR, Butler JA, Gotsch KE, Johnson RL, Reichard AA, Webb KW, Coronado VG, Selassie AW, Thurman DJ.National Center for Injury Prevention and Control, CDC, USA.Motor-vehicle crashes, falls, and assaults were the leading causes of injury for TBI-related discharges. Rates were highest for American Indians and Alaska Natives and Blacks. Data in this report indicate the importance of TBI as a public health problem.
Abstracts • J Trauma. 2001 Sep;51(3):481-9. Epidemiology of severe brain injuries: a prospective population-based study.Masson F, Thicoipe M, Aye P, Mokni T, Senjean P, Schmitt V, Dessalles PH, Cazaugade M, Labadens P; Aquitaine Group for Severe Brain Injuries Study.Department of Anesthesia, University Hospital of Bordeaux, 33076 Bordeaux cedex, France.19 hospitals in the region. Incidence rate of severe TBI – 17.3 per 100,000. Traffic accidents – 48.3%, falls 41.8%. Fatality rate 30%.
Abstracts • World J Surg. 2001 Sep;25(9):1230-7. Neurotrauma in Pakistan.Raja IA, Vohra AH, Ahmed M.Department of Neurosurgery, King Edward Medical College, 40-C, Zafar Ali Road, Gulberg V, Lahore, Pakistan. aliraja@brain.net.pkLead cause – road traffic accidents. Mild head injury – 52%, moderate – 30%, severe 18%. Total mortality 18%.
Abstracts • World J Surg. 2001 Sep;25(9):1205-9. Neurosurgical trauma in Japan.Maejima S, Katayama Y.Department of Neurological Surgery, Nihon University School of Medicine, Oyaguchi Kami-machi 30-1, Itabashi-Ku, Tokyo, 173-8610, Japan. smaejima@med.nihon-u.ac.jpJapan Neurotrauma Data Bank System introduced recently – statistics of 10 major neurotrauma centers
Abstracts – age specific – children • Acta Paediatr. 1997 Jul;86(7):730-5. Epidemiology of traumatic brain injury in children and adolescents in south-western Sweden.Emanuelson I, v Wendt L.Bracke Ostergard Regional Pediatric Rehabilitation Centre, Goteborg,Sweden. Age 0-17. Incidence rate 12 per 100,000. The dominant external cause was traffic (60%), followed by falls (22%).
Abstracts – age specific – children • Injury. 2003 May;34(4):256-60. Prevalence of traumatic brain injury amongst children admitted to hospital in one health district: a population-based study.Hawley CA, Ward AB, Long J, Owen DW, Magnay AR.Centre for Health Services Studies, University of Warwick, Coventry CV4 7AL, UK. c.a.hawley@warwick.ac.ukNorth Staffordshire – registry of children TBI since 1992. Incidence 280 per 100,000 children are admitted for >or=24h with a TBI, of these 232 will have a mild brain injury, 25 moderate, 17 severe, and 2 will die. Children under 2 years of age account for 18.5% of all TBIs, usually due to falls, being dropped or non-accidental injuries (NAIs). Falls account for 60% of TBIs in the under 5 years. In the 10-15 age group road traffic accidents (RTAs) were the most common cause (185, 36.7%).
Abstracts – age specific – children • JAMA. 2003 Aug 6;290(5):621-6. A population-based study of inflicted traumatic brain injury in young children.Keenan HT, Runyan DK, Marshall SW, Nocera MA, Merten DF, Sinal SH.Department of Social Medicine, University of North Carolina at Chapel Hill, NC 27599-7240, USA. hkeenan@med.unc.eduA total of 152 cases of serious or fatal TBI were identified, with 80 (53%) incurring inflicted TBI.
Statistics – Austria: Fatal accidents per 100,000 inhab. 1992 44,6 1993 40,1 1994 39,7 1995 40,5 1996 36,9 1997 34,8 1998 33,6 1999 30,9 2000 33,2 2001 33,0 2002 31,9
Health for all – Austria 2000 • SDR, external cause injury and poison, 0-64 per 100000 38.97 • SDR, external causes of injury and poison, age 0-4 years 10.65 • SDR, external causes of injury and poison, age 5-19 years 7.09 • SDR, external cause injury and poison, all ages per 100000 47.56 • SDR, external cause injury and poison, 65+ per 100000 117
Health for all – Austria 2000 • SDR, motor vehicle traffic accidents, 0-64 per 100000 9.8 • SDR, motor vehicle traffic accidents, all ages per 100000 9.99 • SDR, motor vehicle traffic accidents, 65+ per 100000 11.57 • SDR, other external causes, 0-64 per 100000 13.18 • SDR, other external causes, all ages per 100000 19.14 • SDR, other external causes, 65+ per 100000 67.38
Health for all – Austria 2000 • SDR, transport accidents, per 100000 11 = 2% of all causes • SDR, all causes, all ages, per 100000 658.48