Download
1 / 24
340 likes | 3.74k Views
Overview. Project ObjectivesProject Planning and ExecutionBackground and Experimental MethodsResults and ConclusionsRecommendations and Future Work. Project Objectives. Develop reaction kinetic data for the saponification of ethyl acetate by sodium hydroxide.Develop calibration curves for electric conductivity cell, using known concentrations of reactants and productsCalibration of pump settings on Plug Flow Reactor (PFR).Ran Batch Reactor and PFR and gathered kinetic rate data .

E N D
1. Saponification of Ethyl acetate by Sodium hydroxide in a Plug Flow Reactor Lindsey Kato
Shawna Togioka
Luke Sugie
February 2, 2005
3. Project Objectives Develop reaction kinetic data for the saponification of ethyl acetate by sodium hydroxide.
Develop calibration curves for electric conductivity cell, using known concentrations of reactants and products
Calibration of pump settings on Plug Flow Reactor (PFR).
Ran Batch Reactor and PFR and gathered kinetic rate data I don�t think it is �correct� to have a �1� subheading if there is not at least a �2� as well. Explain what is different between the rate constant you obtain from the batch reactor and the one you get from the PFR.I don�t think it is �correct� to have a �1� subheading if there is not at least a �2� as well. Explain what is different between the rate constant you obtain from the batch reactor and the one you get from the PFR.
4. Project Planning Roles & Responsibilities
Team Leader � Lindsey Kato
Planning agenda, Assigning tasks and goals, presentation
Operations Coordinator � Shawna Togioka
Knowledge of equipment, data collections and laboratory documentation
Safety Coordinator � Luke Sugie
Hazards of the Lab, chemical safety, MSDS
Group: Background data collection and analysis
5. Key Planning Elements Project Plan / Time Table
Learn about the lab, equipment, safety, hazards
Calibration Tests
Batch Reactor Tests
PFR Tests
Analysis
Oral Presentation
Written Reports
6. Lessons Learned Some activities take longer than expected
Experiments don�t always run smoothly. Must rethink the experimental design.
Overall � Lab time was utilized and original project plan didn�t need to be altered. The wording �come out� seems a bit awkward. I would try to think of a word that is more descriptive.The wording �come out� seems a bit awkward. I would try to think of a word that is more descriptive.
7. Background Information Reaction:
Ethyl acetate+Sodium Hydroxide ? Sodium acetate+Ethanol
C2H5O2CCH3 + Na-OH ? CH3CO2Na + H3C-CH2-OH
Theory:
-rOH = -dCOH/dt = -dCEt-O-Ac/dt = k*COH*CEt-O-Ac
A second order bimolecular reaction.
Literature Value1,2:
kOH = 0.111 L/mole-sec at 25�C
Irreversible reaction
8. Equipment Conductivity Meter
Uses: measured
the conductivity
in the batch reactions
and PFR experiments
Preparation: calibrated at
beginning of every lab
period.
Calibration curves were constructed
with different concentrations of
reactants and products.
9. Equipment Constant Water Bath
-Batch Reaction
experiments done
at 25�C
-Reactants were
submerged in the
bath to reach temp.
and then put together
for the experiment.
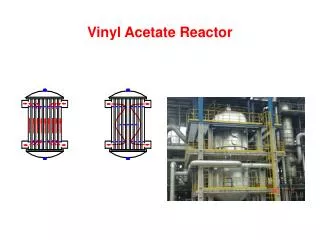
10. Equipment Plug Flow Reactor
-Packed with small
spherical balls
-Bed Void Fraction3, e, of
~0.41
-Equimolar concentrations of
NaOH and Ethyl Acetate
were pumped into PFR
-Conductivity meter used to
determine the composition
of the product stream.
-Experiment finished once
reaction reached equilibrium.
11. Experiments Testing was done on the PFR pumps to determine the resonance time for each pump at different settings.
Calibration curves were generated for the conductivity meter for known concentrations of reactants and products.
Batch reactions were done using equimolar concentrations of reactants.
PFR experiments were done using equimolar concentrations and approx. equal molar flows.
12. Batch Reactor Experiments Bath was set to 25�C
Reactants were measured and put in bath separately to heat.
Combined reactants and conductivity measurements taken at 5 and 10 second intervals.
Batches were constantly stirred for the duration of the experiment. All tests were done at 25C. Before the experiment was started the reactants were placed in the batch reactor to equilibrate to the temperature before the experiment began. There were then combined together and reading were taken. To ensure that we got all the data measurements were taken every 5 sec initially and 10 seconds after a couple of minutes. To ensure good mixing the batch experiments were stirred continuously through out the experiment using the conductivity probe.All tests were done at 25C. Before the experiment was started the reactants were placed in the batch reactor to equilibrate to the temperature before the experiment began. There were then combined together and reading were taken. To ensure that we got all the data measurements were taken every 5 sec initially and 10 seconds after a couple of minutes. To ensure good mixing the batch experiments were stirred continuously through out the experiment using the conductivity probe.
13. PFR Experiments Large quantities of equimolar mixture of Ethyl acetate and NaOH were prepared and placed at the inlet for each pump.
The pumps were set so that the flow rates of each of the reactants would be equal.
Conductivity Meter was connected to the PFR at the outlet and readings were taken during the experiment.
Experiment was finished once the conductivity reached a steady state. To run the PFR experiments we prepared large quantities of equimolar mixtures of ethyl acetate and sodium hydroxide and they were placed at the inlet tubes to the PFR.
The pumps were set so that they were at flow rates. This required us to interpolate, because when calibrating the pumps did not have equal volumetric flow rates.
The conductivity meter was connected to the PFR, so that reading could be taken during the experiment.
Reading were taken during the entire experiment, and were stopped once a steady state had been reached. We were only interest in the steady state value for the PFR, but for our data collection we wanted to see how the conductivity was changing with time.To run the PFR experiments we prepared large quantities of equimolar mixtures of ethyl acetate and sodium hydroxide and they were placed at the inlet tubes to the PFR.
The pumps were set so that they were at flow rates. This required us to interpolate, because when calibrating the pumps did not have equal volumetric flow rates.
The conductivity meter was connected to the PFR, so that reading could be taken during the experiment.
Reading were taken during the entire experiment, and were stopped once a steady state had been reached. We were only interest in the steady state value for the PFR, but for our data collection we wanted to see how the conductivity was changing with time.
14. Key Equations Batch Reactor
COH=CEt-O-Ac
Relationship:
1 = k*t + 1
COH COHo
PFR
COH=CEt-O-Ac
Relationship:
1 * XOH = k*t t = V/vo (Space-time)
COH 1- XOH For all trials that were preformed a equimolar concentration of sodium hydroxide and ethyl acetate were used. Here are theoretical equation that relate the concentration for sodium hydroxide to the kinetic rate constant.For all trials that were preformed a equimolar concentration of sodium hydroxide and ethyl acetate were used. Here are theoretical equation that relate the concentration for sodium hydroxide to the kinetic rate constant.
15. Results � Conductivity Calibration Measurements were taken with pure NaOH, 50-50% concentration NaOH and Sodium acetate, and pure sodium acetate. This graph only contains two the points. Unfortunately when analyzing the data the 50-50 concentration was very different and the calculation may be wrong. This was not discovered to late in analysis for us to correct.This graph only contains two the points. Unfortunately when analyzing the data the 50-50 concentration was very different and the calculation may be wrong. This was not discovered to late in analysis for us to correct.
16. Results � Batch Reactor The kinetic rate constant is the initial slope at the start of the experiment. For data analysis on the first 100 seconds were used. After this point the slope of the line began to change, and we wanted to find the initial rate constant for the reaction.For data analysis on the first 100 seconds were used. After this point the slope of the line began to change, and we wanted to find the initial rate constant for the reaction.
17. Results � Batch Reactor It is hard to read the axes on these graphs...consider placing fewer graphs on each slide.It is hard to read the axes on these graphs...consider placing fewer graphs on each slide.
18. Results - PFR The flow rate of the pumps was varied to five different settings for data collection.
19. Results � Batch and Plug Flow Reactor Batch Reactor showed a kinetic rate constant of ~0.19 L/mole-sec
Tests showed the rate constant to be 2 times higher than literary value, but was consistent for all trials.
Plug Flow Reactor showed the kinetic rate constant to be ~0.24L/mole-sec
The experimental value was 2.5 times higher than the literary value.
20. Major Conclusions The kinetic rate constant for batch is 0.19 L/mole-sec
The kinetic rate constant for a PFR is 0.24 L/mole-sec.
The literary value was 0.111 L/mole-sec
Discrepancies in the experiment and literature could be caused from slightly unequal concentrations, incorrect molar flow rates, or conductivity calibration problems.
Reaction data showed characteristics of being second order as theory predicted. Is the rate constant supposed to be the same for the batch and the PFR? I was under the impression that the PRF would yield �different� results from the literary value and I thought that there was a specific reason for that...but I might be wrong...just a thought. Sorry I don�t have time to look into it more now.Is the rate constant supposed to be the same for the batch and the PFR? I was under the impression that the PRF would yield �different� results from the literary value and I thought that there was a specific reason for that...but I might be wrong...just a thought. Sorry I don�t have time to look into it more now.
21. Lessons Learned Some activities take longer than expected
Experiments don�t always run smoothly. Must rethink the experimental design.
Overall � Lab time was utilized and original project plan didn�t need to be altered. The wording �come out� seems a bit awkward. I would try to think of a word that is more descriptive.The wording �come out� seems a bit awkward. I would try to think of a word that is more descriptive.
22. Future Recommendations More careful research done early on, so work in the lab could go more smoothly.
Run more trials on the PFR and batch to confirm data.
Plan out your lab times carefully and set reasonable goals and be safe. If more research had been done, and we as a group would have understood the project better, and some mistakes that were made early on in the lab may have been avoided.
More trials should have been run on the PFR and batch to confirm data. Especially on the PFR, which didn�t get as many trials, because time was short.
As far as the project plan and safety. Our group worked very well together and were safe in the process. Our Project plan had about the right amount of goals each day and we were always able to complete them. If more research had been done, and we as a group would have understood the project better, and some mistakes that were made early on in the lab may have been avoided.
More trials should have been run on the PFR and batch to confirm data. Especially on the PFR, which didn�t get as many trials, because time was short.
As far as the project plan and safety. Our group worked very well together and were safe in the process. Our Project plan had about the right amount of goals each day and we were always able to complete them.
23. References Bamford, C.H. and C.F.H. Tipper. 1970. Comprehensive Chemical Kinetics v.10. Elsevier Publishing Company. New York. p.169.
Batch Reactor Kinetic Analysis. Jan 15, 2005. www.csupomona.edu/~tknguyen/che435/Notes/P5-kinetic.pdf
Levenspiel, Octave. 1998. Engineering Flow and Heat Exchange. Plenum Press. New York. p.128.
24. Questions?