Download
1 / 25
260 likes | 491 Views
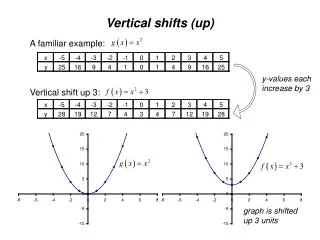
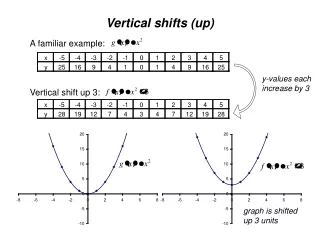
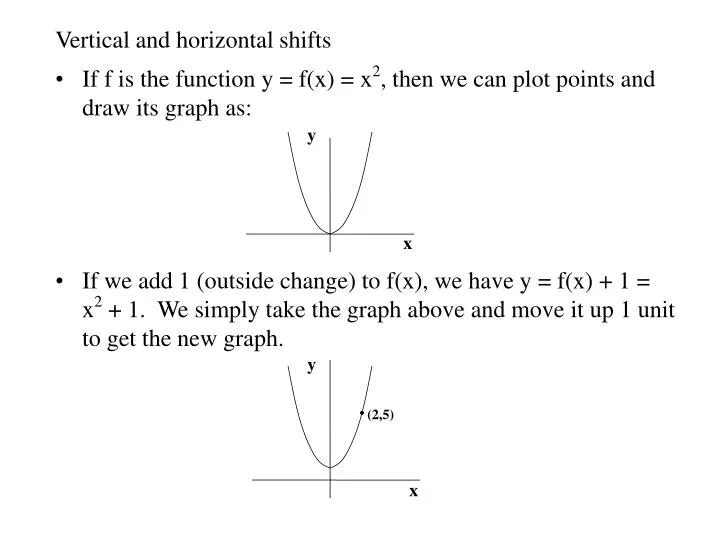
Vertical and horizontal shifts. If f is the function y = f(x) = x 2 , then we can plot points and draw its graph as: If we add 1 (outside change) to f(x), we have y = f(x) + 1 = x 2 + 1. We simply take the graph above and move it up 1 unit to get the new graph. y. x. y. (2,5). x.

E N D
Vertical and horizontal shifts • If f is the function y = f(x) = x2, then we can plot points and draw its graph as: • If we add 1 (outside change) to f(x), we have y = f(x) + 1 = x2 + 1. We simply take the graph above and move it up 1 unit to get the new graph. y x y (2,5) x
If we replace x by x+2 (inside change) to form the function y = f(x+2) = (x+2)2, then the corresponding graph is obtained from the graph of y = x2 by moving it 2 units to the left along the x-axis. • If we replace x by x–1 (inside change) to form the function y = f(x–1) = (x–1)2, then the corresponding graph is obtained from the graph of y = x2 by moving it 1 unit to the right along the x-axis. y x (-2,0) y x (1,0)
If y = g(x) is a function and k is a constant, then the graph of: • y = g(x) + k is the graph of y = g(x) shifted vertically by |k| units. If k > 0, the shift is up, and if k < 0, the shift is down. • y = g(x+k) is the graph of y = g(x) shifted horizontally by |k| units. If k > 0, the shift is left, and if k < 0, the shift is right. Horizontal and vertical shifts of the graph of a function are called translations.
An example which combines horizontal and vertical shifts • Problem. Use the graph of y = f(x) = x2 to sketch the graph of g(x) = f(x–2) – 1 = (x–2)2 – 1. Solution. The graph of g is the graph of f shifted to the right by 2 units and down 1 unit as shown below. y x (2,-1)
Reflections and symmetry • Suppose that we are given the function y = f(x) as shown. • If we define y = g(x) = –f(x), then the graph of g may be obtained by reflecting the graph of f vertically across the x-axis as shown next. y x y x
Continuation of example from previous slide • If we define y = h(x) = f(–x), then the graph of h is obtained by reflecting the graph of f horizontally across the y-axis as shown next. • Next, we define y = p(x) = –f(–x). The graph of p is obtained by reflecting the graph of f about the origin as shown next. y x y x
For any function f: • The graph of y = –f(x) is the reflection of the graph of y = f(x) across the x-axis. • The graph of y = f(–x) is the reflection of the graph of y = f(x) across the y-axis. • The graph of y = –f(–x) is the reflection of the graph of y = f(x) about the origin. Note that this reflection can be obtained by applying the two previous reflections in sequence.
Symmetries of graphs • A function is called an even function if, for all values of x in the domain of f, The graph of an even function is symmetric across the y-axis. Examples of even functions are power functions with even exponents, such as y = x2, y = x4, y = x6, ... • A function is called an odd function if, for all values of x in the domain of f, The graph of an odd function is symmetric about the origin. Examples of odd functions are power functions with odd exponents, such as y = x1, y = x3, y = x5, ...
Problem. Is the function f(x) = x3+x even, odd, or neither? Solution. Since –2 = f(–1) is not equal to f(1) = 2, it follows that f is not even. Since f(–x) = = –f(x), it follows that f is odd. y = x3+x Note the symmetry about the origin.
Problem. Is the function f(x) = |x| even, odd, or neither? Solution. Since f(–x) = |x| = f(x), it follows that f is even. Since 1 = f(–1) is not equal to –f(1) = –1, it follows that f is not odd. • Question. Is it possible for a function to be both even and odd? y = |x| Note the symmetry about the y-axis.
Combining shifts and reflections--an example • In an earlier example, we discussed an investment of $10000 in the latest dotcom venture. This investment had a value of 10000(0.95)t dollars after t years. Suppose that we want to graph the amount of the loss after t years for this investment. The formula for the loss is: 10000 – 10000(0.95)t • The loss is graphed on the next slide using Maple. Shift Upwards Reflect across t-axis
Use of Maple to graph loss on dotcom investment > plot({10000,10000-10000*(0.95)^t},t=0..80, color=black,labels=["t","L"]); The graph of the loss has a horizontal asymptote, L = 10000.
Vertical Stretches and Compressions • If f(x) = x2 and g(x) = 5x2, then the graph of g is obtained from the graph of f by stretching it vertically by a factor of 5 as the following Maple plot shows:
If f(x) = x2 and g(x) = -5x2, then the graph of g is obtained from the graph of f by stretching it vertically by a factor of 5 and then reflecting it across the x-axis as the following Maple plot shows:
If we compare the graphs of f(x) = x2 and g(x) = (1/2)x2, we notice that the graph of g can be found by vertically compressing the graph of f by a factor of 1/2. • Generalizing the above examples yields the following: If f is a function and k is a constant, then the graph of y = kf(x) is the graph of y = f(x) • Vertically stretched by a factor of k, if k > 1. • Vertically compressed by a factor of k, if 0 < k < 1. • Vertically stretched or compressed by a factor |k| and reflected across the x-axis, if k < 0.
Vertical Stretch Factors and Average Rates of Change • If f(x) = x2 and g(x) = 5x2, we compute the average rates of change of the two functions on the interval [1,3] as follows: • The above computation illustrates a general fact:
If f(x) = 4–x2 and g(x) = 4 – (2x)2, then the graph of g is obtained from the graph of f by compressing it horizontally by a factor of 1/2 as the following Maple plot shows:
If f(x) = 4–x2 and g(x) = 4 – (0.5x)2, then the graph of g is obtained from the graph of f by stretching it horizontally by a factor of 2 as the following Maple plot shows:
Generalizing the two previous examples yields the following results for horizontal stretch or compression. • If f is a function and k is a positive constant, then the graph of y = f(kx) is the graph of f • Horizontally compressed by a factor of 1/k if k > 1. • Horizontally stretched by a factor of 1/k if k < 1. If k < 0, then the graph of y = f(kx) also involves a horizontal reflection about the y-axis.
Combining transformations • For nonzero constants A, B, h and k, the graph of the function is obtained by applying the transformations to the graph of f in the following order: • Horizontal stretch/compression by factor of 1/|B| • Horizontal shift by h units • Vertical stretch/compression by factor of |A| • Vertical shift by k units • If A<0, follow the vertical stretch/compression by a reflection about the x-axis. • If B<0, follow the horizontal stretch/compression by a reflection about the y-axis.
Example for combining transformations • Let y = 5(x+2)2+7. Use the method of the preceding slide to graph this function. • First, we let f(x) = x2 so that A = 5, B = 1, h = –2 and k = 7. Based on these values, we carry out these steps • Horizontal shift 2 to the left of the graph of f(x) = x2. • Vertical stretch of the resulting graph by factor of 5. • Vertical shift of the resulting graph up by 7. • Since B = 1, there is no horizontal compression, stretch, or reflection. • You should compare this result with the use of the vertex form of a quadratic function from Chapter 3. See the next slide for the graph.
Another example • Let f(x) = |x|. Use the method previously described to analyze y = |3(x–1)|. • Here, A = 1, B = 3, h = 1, k = 0. We have a horizontal compression by a factor of 1/3 followed by a horizontal shift of 1 unit to the right. f(x) f(3x) f(3(x–1))
Summary for Transformation of Functions and their Graphs • If y = g(x) is a function and k is a constant, then the graph of y = g(x) + k is the graph of y = g(x) shifted vertically by |k| units. • If y = g(x) is a function and k is a constant, then the graph of y = g(x+k) is the graph of y = g(x) shifted horizontally by |k| units. • A function is called an even function if, for all values of x in the domain of f, f(–x) = f(x). The graph of an even function is symmetric across the y-axis. • A function is called an odd function if, for all values of x in the domain of f, f(–x) = –f(x). The graph of an odd function is symmetric about the origin.
Summary for Transformation of Fcts and their Graphs, cont’d • When a function f(x) is replaced by kf(x), the graph is vertically stretched or compressed and the average rate of change on any interval is also multiplied by k. If k is negative, a vertical reflection about the x-axis is also involved. • When a function f(x) is replaced by f(kx), the graph is horizontally stretched or compressed by a factor of 1/|k| and, if k < 0, reflected horizontally about the y-axis. • The graph of the function is obtained by sequentially applying transformations to the graph of f.