Download
1 / 35
350 likes | 463 Views
4 th PHC/Sakura France-Japan Workshop / 3 rd Europlanet Strategic Workshop / 5 th – 8 th March. Water Vapour Abundance and Distribution in the Lower Atmosphere of Venus. IRIS2, Anglo- Australian Telescope. Sarah Chamberlain – CAAUL / Lisbon Observatory, Portugal.

E N D
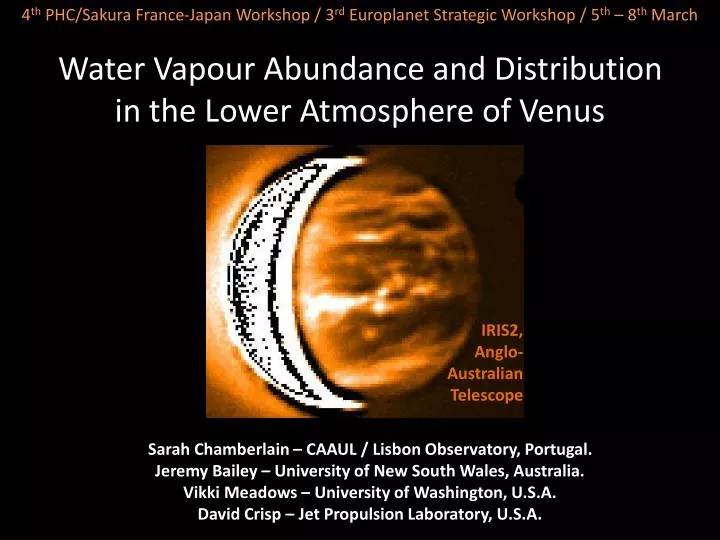
4th PHC/Sakura France-Japan Workshop / 3rd Europlanet Strategic Workshop / 5th – 8th March Water Vapour Abundance and Distribution in the Lower Atmosphere of Venus IRIS2, Anglo- Australian Telescope Sarah Chamberlain – CAAUL / Lisbon Observatory, Portugal. Jeremy Bailey – University of New South Wales, Australia.Vikki Meadows – University of Washington, U.S.A.David Crisp – Jet Propulsion Laboratory, U.S.A.
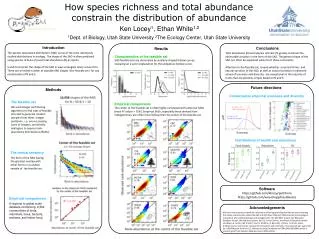
λ Alt. 2.3µm – 35km 1.74µm – 24km 1.18µm – 15km Venus Crescent Venus Near Infrared Wavelengths
H2O absorption CO2 absorption
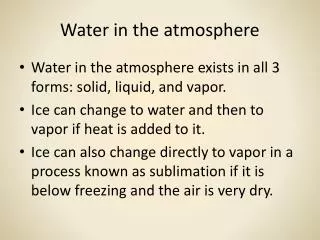
Chemical models suggest the lower atmosphere should have a constant water vapour abundance and even distribution.
(Meadows and Crisp, 1996)AAT/IRIS VEX: VIRTIS M 2500 VEX: VIRTIS H (This Study)AAT/IRIS2 VEX: SPICAV (De Berg et al, 1995)CFHT/FTS
The Observations Venus : Optical wavelengths –Anglo-Australian Telescope /IRIS2 instrument Venus : Near infrared wavelengths
O2 Airglow Thermal image Full-disk spatially resolved spectra - R ~ 2500
Solar spectrum Removing the correct terrestrial water vapour contribution Is complex: Standard star observations are usually obtained At a different time, airmass and through a different path Length. Venus
THE Model 1: Model the transmittance spectra for the earth 2: Multiply the modelled transmittance spectra to modelled Venus spectra for various Venus water vapour abundances. 3: Find the best fit modelled spectra for each extracted observed spectra from various locations.
Model sensitivity with altitude for the 1.18 micron window Note for later: that this region is insensitive to water vapour close to the Venus surface
Model Parameters that DO NOT affect the 1.18 µm window shape and therefore the contrast of the water vapour absorption peaks. • Emission angle Zenith angle • Emissivity/Albedo • Lapse Rate
Emissivity Lapse Rate
Model Parameters that DO affect the 1.18 µm window shape and therefore the contrast of the water vapour absorption peaks • Abundance gradient • (at sensitive altitudes) • - Line list completeness • - CO2 Line shape (at high temperatures • and pressures)
Line shape Figure from Meadows and Crisp, 1996
CO2 Line shape Where and is a modification of that of Perrin and Hartmann (1989) as determined by Meadows and Crisp (1996). The values of and are given in the table below. Coefficients for the CO2χ factor ,
Venus spectra were then extracted from across the disk of Venus and RMS fitted against various water vapour abundances and for different spectral regions of the 1.18 µm window. The Results Have been checked for spatial variations and for the best fit water vapour abundance.
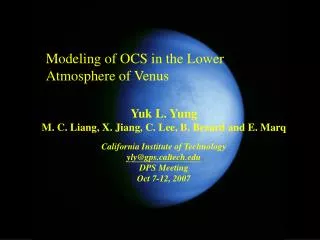
Best fit water vapour abundance against x position Matched to F1 ~ 1.174 µm Matched to F2 ~ 1.178µm Matched to F3 Matched to F3 ~ 1.182 µm Matched to 1.175 – 1.185 µm
Best fit water vapour abundance against y position Matched to F1 ~ 1.174 µm Matched to F2 ~ 1.178 µm Matched to F3~ 1.182 µm Matched to 1.175 – 1.185 µm
Vatriations in Water Vapour with altitude Matched to F1 ~ 1.174 µm Matched to F1 ~ 1.174 µm Matched to F2 ~ 1.178 µm Matched to F1 ~ 1.174 µm Matched to F3 ~ 1.182 µm Matched to 1.175 - 1.185 µm
Matched to F1~ 1.174 µm Matched to F2~ 1.178 µm Matched to 1.175 – 1.185 µm Matched to F3~ 1.182 µm
Observed Spectra f3 f2 f1
Higher spectral resolutions will obtain a smaller spread of results.
Observed Spectra multiple unresolved absorption peaks f1
Water vapour in the Lowest 4 km D B Position F (0 km) / Position A (4km) F A C E 0kmaltitude 4kmaltitude Water Vapour absorption from the lowest 4 km of the Venus atmosphere is observed in the gradient and individual features.
Conclusions • 32ppmv water vapour at around 16km altitudes • This result agrees with previous studies. • Uncertainties connected to : The far wing absorption / continuum • The completeness of the CO2 line list • Higher spectral resolution observations would aid this study by better defining the absorption peak shape and also resolving the multiple bands that contribute to some of the absorption peaks. • There is a possibility that near surface (0 – 4 km) water vapour abundances can be determined from remote observations.
Installation of the Venus GCM at the Lisbon Observatory David Luz CAAUL/Obs. Astronomico de Lisboa Sarah Chamberlain CAAUL/Obs. Astronomico de Lisboa Sebastien Lebonnois Lab. de Meteorologie Dynamique /Lawrence Livermore National Lab.
Venus General Circulation Model (0 – 100km altitude) The dynamical core of the GCM is based on the LMDZ Earth model developed at the Laboratoire de meteorologie Dynamique. (Hourdin et al., 2006) Key Features: - Topography - Diurnal cycle - Dependence of the specific heat on temperature - Consistent radiative transfer module based on net exchange rate matrices (consistent computation of the temperature field as opposed to simple temperature forcing).Consistent with observations: - Superrotation above roughly 40km with comparatively small winds beneath - Meridional circulation consists of equator to pole cells - Temperature structure is globally consistent (with discrepancies in the stability of the lowest layers and equator to pole temperature contrasts within the clouds) - Convective layers at the base of the clouds and the middle of the clouds
Intended use of the Model: Angular Momentum Budget with respect to circulation components. Mean meridional circulation Transient waves Polar Regions: The dynamical behaviour at polar regions The solar tides in the polar regions The rotational and thermal properties near the poles (the presence of the dipole). S-shaped pattern of the southern polar vortex (polar dipole). The centroid is shown to be displaced by 3 degrees from the geographic south pole.(VIRTIS - 5 µm radiance map from orbit 38.)Luz et al., 2011
Current Status: Sebastien Lebonnois has provided us with two models: - A reference model that has been run for 250 Venus days where the atmosphere was started with the superrotation fully developed. - A second model that has been run for 1050 Venus days from an atmosphere initially at rest. We are currently working on stabilising a zoomed version of the reference GCM that is focussed on the polar regions. Image shows the Zonal flow as Produced by the Reference model After 254 Venus days.