Download
1 / 44
440 likes | 560 Views
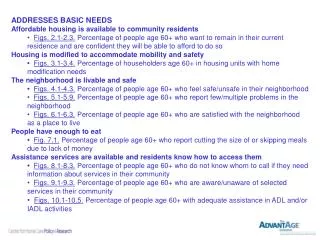
ADDRESSES BASIC NEEDS Affordable housing is available to community residents • Fig. 2.1. Percentage of people age 60+ who want to remain in their current residence and are confident they will be able to afford to do so Housing is modified to accommodate mobility and safety

E N D
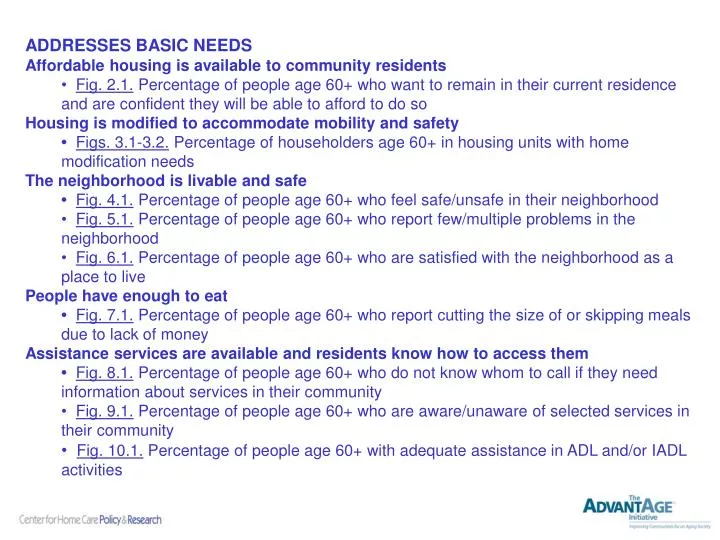
ADDRESSES BASIC NEEDS Affordable housing is available to community residents • Fig. 2.1. Percentage of people age 60+ who want to remain in their current residence and are confident they will be able to afford to do so Housing is modified to accommodate mobility and safety • Figs. 3.1-3.2. Percentage of householders age 60+ in housing units with home modification needs The neighborhood is livable and safe • Fig. 4.1. Percentage of people age 60+ who feel safe/unsafe in their neighborhood • Fig. 5.1. Percentage of people age 60+ who report few/multiple problems in the neighborhood • Fig. 6.1. Percentage of people age 60+ who are satisfied with the neighborhood as a place to live People have enough to eat • Fig. 7.1. Percentage of people age 60+ who report cutting the size of or skipping meals due to lack of money Assistance services are available and residents know how to access them • Fig. 8.1. Percentage of people age 60+ who do not know whom to call if they need information about services in their community • Fig. 9.1. Percentage of people age 60+ who are aware/unaware of selected services in their community • Fig. 10.1. Percentage of people age 60+ with adequate assistance in ADL and/or IADL activities
Figure 2.1, Indiana-Gary Midtown NNORC Percentage of people age 60+ who want to remain in their current residence and are confident they will be able to afford to do so Not Very Confident** 35% Disagree ‡ Agree* 96% 4% Very Confident 65% Unweighted N=97 Weighted N=1,127 Unweighted N=101 Weighted N=1,171 We asked respondents whether they agree or disagree with the following statement: “What I’d really like to do is stay in my current residence for as long as possible.” For people who answered “agree” we calculated the percentage of adults age 60+ who were very confident/not very confident that they will be able to afford to live in their current residence for as long as they would like. Note: Percentages may not add up to 100% due to rounding and/or missing information. *Agree includes those who said Strongly agree or Somewhat agree. **Not Very Confident includes those who said Somewhat confident, Not too confident, Not confident at all, Don’t know, or Refused. ‡ This percentage is based on fewer than 20 respondents (Unweighted N<20) and should be interpreted with caution. Source: AdvantAge Initiative Community Survey in Indiana 2008
Figure 3.1, Indiana-Gary Midtown NNORC Percentage of householders age 60+ in housing units with home modification needs* Not planning to modify ‡ 10% No modifications needed 60% One or more modification needed 40% Planning to modify 90% Unweighted N=101 Weighted N=1,171 Unweighted N=40 Weighted N=470 *People were asked whether their current residence needs any significant repairs, modifications, or changes to improve their ability to live there over the next five years. *People who said that their homes need modification were asked if they plan to make the change over the next five years. Note: Percentages may not add up to 100% due to rounding and/or missing information. ‡ This percentage is based on fewer than 20 respondents (Unweighted N<20) and should be interpreted with caution. Source: AdvantAge Initiative Community Survey in Indiana 2008
Figure 3.2, Indiana-Gary Midtown NNORC Type of modification needed Cosmetic/minor repairs Structural changes/ major repairs Better heating in the winter Better cooling in the summer ‡ Bathroom modification ‡ Fix problem with insects/rodents ‡ Medical emergency response system ‡ ‡ Other Unweighted N=101 Weighted N=1,171 Accommodations for disabilities ‡ ‡ This percentage is based on fewer than 20 respondents (Unweighted N<20) and should be interpreted with caution. Source: AdvantAge Initiative Community Survey in Indiana 2008
Figure 4.1, Indiana-Gary Midtown NNORC Percentage of people age 60+ who feel safe/unsafe in their neighborhood* Safety- Good 30% Safety-Fair/Poor 27% DK/RF 2% Safety- Excellent/ Very Good 41% ‡ Unweighted N=101 Weighted N=1,171 Note: Percentages may not add up to 100% due to rounding and/or missing information. *People were asked whether safety in their neighborhood is excellent, very good, good, fair, or poor. ‡ This percentage is based on fewer than 20 respondents (Unweighted N<20) and should be interpreted with caution. Source: AdvantAge Initiative Community Survey in Indiana 2008
Figure 5.1, Indiana-Gary Midtown NNORC Prevalence of Perceived Neighborhood Problems Streets need repair Rundown buildings Crime Poor public service People don’t get involved Not enough arts/culture Streets too dark Lack of affordable housing Distance from shopping Public transportation Distance from parks Noise Traffic Unweighted N=101 Weighted N=1,171 Traffic lights too few/too fast *People were read a list of fourteen neighborhood problems and were asked to indicate whether each item posed a big problem, small problem, or no problem in their neighborhood. Source: AdvantAge Initiative Community Survey in Indiana 2008
Figure 6.1, Indiana-Gary Midtown NNORC Percentage of people age 60+ who are satisfied with the neighborhood as a place to live* Not Very Satisfied** 55% DK/RF 1% ‡ Very Satisfied 44% Unweighted N=101 Weighted N=1,171 Note: Percentages may not add up to 100% due to rounding and/or missing information. *People were asked how satisfied they are with their neighborhood as a place to live. **The category “Not very satisfied” includes those who said they were somewhat satisfied, somewhat dissatisfied, or very dissatisfied with their neighborhood. ‡ This percentage is based on fewer than 20 respondents (Unweighted N<20) and should be interpreted with caution. Source: AdvantAge Initiative Community Survey in Indiana 2008
Figure 7.1, Indiana-Gary Midtown NNORC Percentage of people age 60+ who report cutting the size of or skipping meals due to lack of money* Cut the size of or skipped meals ‡ 5% Did not cut or skip meals 95% Unweighted N=101 Weighted N=1,171 Note: Percentages may not add up to 100% due to rounding and/or missing information. *People were asked if in the past 12 months they or another adult in their household cut the size of or skipped meals because there wasn’t enough money for food. ‡ This percentage is based on fewer than 20 respondents (Unweighted N<20) and should be interpreted with caution. Source: AdvantAge Initiative Community Survey in Indiana 2008
Figure 8.1, Indiana-Gary Midtown NNORC Percentage of people age 60+ who do not know whom to call if they need information about services in their community* Do Not Know Whom to Call 34% Other Family/ Neighbors 3% ‡ ‡ 5% Internet/ Phone Book/ Other Media 12% City/County/ Office of Aging/ Social Services/ Other Agency 23% ‡ ‡ 3% Medical Center/ Health Professional 15% Senior Center 5% ‡ Unweighted N=101 Weighted N=1,171 Church/Synagogue ‡ Note: Percentages may not add up to 100% due to rounding and/or missing information. *People were asked to indicate the best resource, such as a person or an organization, in their city, town, or county to get information on various services. ‡ This percentage is based on fewer than 20 respondents (Unweighted N<20) and should be interpreted with caution. Source: AdvantAge Initiative Community Survey in Indiana 2008
Figure 9.1, Indiana-Gary Midtown NNORC Percentage of people age 60+ who are aware/unaware of selected services in their community* ‡ ‡ ‡ ‡ ‡ ‡ ‡ ‡ ‡ ‡ ‡ ‡ ‡ ‡ Home- maker Service Home Repair Service Congregate Meals Respite Meals- on- wheels Visiting Nurse Home Health Aide Senior Center Special Trans- portation Hospice Unweighted N=101 Weighted N=1,171 Note: Percentages may not add up to 100% due to rounding and/or missing information. *Respondents were asked whether these 10 services are available in their area. ‡ This percentage is based on fewer than 20 respondents (Unweighted N<20) and should be interpreted with caution. Source: AdvantAge Initiative Community Survey in Indiana 2008
Figure 10.1, Indiana-Gary Midtown NNORC Percentage of people age 60+ with adequate assistance* in ADL and/or IADL activities One or More Unmet Need 54% ‡ One or More ADL/IADL 29% No Limitations 71% All Needs Are Met 46% ‡ Unweighted N=101 Weighted N=1,171 Unweighted N=32 Weighted N=340 *People were asked whether they need assistance with the following activities: ADLs- taking a bath or a shower, dressing, eating, getting in/out of bed/chair, using/getting to a toilet, getting around inside the home and IADLs-going outside the home, doing light housework, preparing meals, driving a car/using public transportation, taking the right amount of prescribed medication, keeping track of money and bills. *People who answered “yes” were asked whether they get enough assistance with these activities. Unmet need was defined as not getting help or not getting enough help for one or more ADLs and/or IADLs for which assistance was needed. Note: Percentages may not add up to 100% due to rounding and/or missing information. ‡ This percentage is based on fewer than 20 respondents (Unweighted N<20) and should be interpreted with caution. Source: AdvantAge Initiative Community Survey in Indiana 2008
OPTIMIZES PHYSICAL AND MENTAL HEALTH AND WELL-BEING Community promotes and provides access to necessary and preventive health services • Fig. 11.1. Rates of screening and vaccination for various conditions among people 60+ • Fig. 12.1. Percentage of people age 60+ who thought they needed the help of a health care professional because they felt depressed or anxious and have not seen one (for those symptoms) • Fig. 13.1. Percentage of people age 60+ whose physical or mental health interfered with their activities in the past month • Fig. 14.1. Percentage of people age 60+ who report being in good to excellent health Opportunities for physical activity are available and used • Figs. 15.1. Percentage of people age 60+ who participate in regular physical exercise Obstacles to use of necessary medical care are minimized • Figs. 16.1-16.2. Percentage of people age 60+ with a usual source of care • Fig. 17.1. Percentage of people age 60+ who failed to obtain needed medical care • Fig. 18.1. Percentage of people age 60+ who had problems paying for medical care • Figs. 19.1. Percentage of people age 60+ who had problems paying for prescription drugs • Figs. 20.1. Percentage of people age 60+ who had problems paying for dental care or eyeglasses Palliative care services are available and advertised • Figs. 21.1-21.2. Percentage of people age 60+ who know whether palliative care services are available
Figure 11.1, Indiana-Gary Midtown NNORC Rates of screening and vaccination for various conditions amongpeople 60+* Percentage of seniors who received each preventive service in the past year ‡ Flu Shot Blood Pressure Eye Exam Hearing Test Physical Exam Bone Density Test Mammogram *** PSA Test** *People were asked whether they had any of the preventive measures or tests above in the past 12 months. Unweighted N=101 Weighted N=1,171 **PSA (prostate cancer screening) test for men only (Unweighted N=24; Weighted N=442) ***Mammogram for women only (Unweighted N=77; Weighted N=729) ‡ This percentage is based on fewer than 20 respondents (Unweighted N<20) and should be interpreted with caution. Source: AdvantAge Initiative Community Survey in Indiana 2008
Figure 12.1, Indiana-Gary Midtown NNORC Percentage of people age 60+ who thought they needed the help of a health care professional because they felt depressed or anxious and have not seen one (for those symptoms)* Has not seen a health professional 48% Needed professional help ‡ Did not need professional help 87% ‡ 13% Has seen a health professional 52% ‡ Unweighted N=14 Weighted N=156 Unweighted N=101 Weighted N=1,171 *People were asked whether in the past year, there was a time when they thought they needed the help of a health professional or a counselor because they felt depressed or anxious. *People who answered “yes” were asked whether they obtained the professional help or counseling they thought they needed. Note: Percentages may not add up to 100% due to rounding and/or missing information. ‡ This percentage is based on fewer than 20 respondents (Unweighted N<20) and should be interpreted with caution. Source: AdvantAge Initiative Community Survey in Indiana 2008
Figure 13.1, Indiana-Gary Midtown NNORC Percentage of people age 60+ whose physical or mental health interfered with their activities in the past month, among those who had one or more unhealthy days* 7 or more days 18% ‡ 1-6 days 25% 1 or more unhealthy days in the past month 35% ‡ None 60% None 56% ‡ 5% DK/RF Unweighted N=36 Weighted N=413 Unweighted N=101 Weighted N=1,171 *The number of “unhealthy” days is based on a summary index from the following two questions: 1. “Now, thinking about your physical health, which includes physical illness and injury, for how many days during the past 30 days was your physical health not good?” and 2. “Now, thinking about your mental health, which includes stress, depression, and problems with emotions, for how many days during the past 30 days was your mental health not good?” *People who had one or more “unhealthy” days were asked “During the past 30 days, for how many days did poor physical or mental health keep you from doing your usual activities, such as self-care, work, or recreation?” Note: Percentages may not add up to 100% due to rounding and/or missing information. ‡ This percentage is based on fewer than 20 respondents (Unweighted N<20) and should be interpreted with caution. Source: AdvantAge Initiative Community Survey in Indiana 2008
Figure 14.1, Indiana-Gary Midtown NNORC Percentage of people age 60+ who report being in good to excellent health* Fair/poor** 28% ‡ DK/RF, 1% Excellent/very good/good 71% Unweighted N=101 Weighted N=1,171 Note: Percentages may not add up to 100% due to rounding and/or missing information. *People were asked: “Would you say that, in general, your health is Excellent, Very good, Good, Fair, Poor, or Very poor?” **Includes people who said their health was Fair, Poor, or Very poor. ‡ This percentage is based on fewer than 20 respondents (Unweighted N<20) and should be interpreted with caution. Source: AdvantAge Initiative Community Survey in Indiana 2008
Figure 15.1, Indiana-Gary Midtown NNORC Percentage of people age 60+ who participate in regular leisure time activity* No activity 36% Some activity 23% Regular leisure time activity 41% Unweighted N=101 Weighted N=1,171 ‡ DK/RF, 1% Note: Percentages may not add up to 100% due to rounding and/or missing information. *“Regular leisure time activity” is defined as 1) light or moderate activity that causes light sweating or a light to moderate increase in breathing or heart rate and occurs five or more times per week for at least 30 minutes each time, and/or 2) vigorous activity that causes heavy sweating or large increases in breathing or heart rate and occurs three or more times per week for at least 20 minutes each time. People who engage in other combinations of the two types of physical activities described above are included in the category “some activity.” Those who are unable to or do not engage or seldom engage in physical activity are included in the category “no activity.” ‡ This percentage is based on fewer than 20 respondents (Unweighted N<20) and should be interpreted with caution. Source: AdvantAge Initiative Community Survey in Indiana 2008
Figure 16.1, Indiana-Gary Midtown NNORC Percentage of people age 60+ with a usual source of care* No usual source of care Have a usual source of care 95% ‡ 4% Unweighted N=101 Weighted N=1,171 Note: Percentages may not add up to 100% due to rounding and/or missing information. *People were asked whether there is a place that they usually go when they are sick or need advice about their health. ‡ This percentage is based on fewer than 20 respondents (Unweighted N<20) and should be interpreted with caution. Source: AdvantAge Initiative Community Survey in Indiana 2008
Figure 16.2, Indiana-Gary Midtown NNORC Source of care used most often* ‡ Emergency room, 1% Hospital outpatient ‡ 6% Doctor’s office 82% ‡ 4% VA Facility 2% ‡ Not one place/ Other/DK/RF ‡ 5% Clinic/Health center Unweighted N=101 Weighted N=1,171 Note: Percentages may not add up to 100% due to rounding and/or missing information. *People were asked what kind of place they go to most often - a clinic, doctor’s office, emergency room, or some other place. ‡ This percentage is based on fewer than 20 respondents (Unweighted N<20) and should be interpreted with caution. Source: AdvantAge Initiative Community Survey in Indiana 2008
Figure 17.1, Indiana-Gary Midtown NNORC Percentage of people age 60+ who failed to obtain needed medical care* Did not obtain care 1% ‡ Needed medical care 49% Did not need medical care 51% Obtained care 99% Unweighted N=101 Weighted N=1,171 Unweighted N=49 Weighted N=579 *People were asked whether in the past year there was a time when they thought they needed medical care because they felt sick. *People who answered “yes” were asked whether they saw a medical professional when they felt sick. Note: Percentages may not add up to 100% due to rounding and/or missing information. ‡ This percentage is based on fewer than 20 respondents (Unweighted N<20) and should be interpreted with caution. Source: AdvantAge Initiative Community Survey in Indiana 2008
Figure 18.1, Indiana-Gary Midtown NNORC Percentage of people age 60+ who had problems paying for medical care* Problem paying for medical care No problem paying for medical care 85% ‡ 15% ‡ DK/RF, 1% Unweighted N=101 Weighted N=1,171 Note: Percentages may not add up to 100% due to rounding and/or missing information. *People were asked whether there was a time in the past 12 months when they did not have enough money to follow up on tests or treatment recommended by a doctor. ‡ This percentage is based on fewer than 20 respondents (Unweighted N<20) and should be interpreted with caution. Source: AdvantAge Initiative Community Survey in Indiana 2008
Figure 19.1, Indiana-Gary Midtown NNORC Percentage of people age 60+ who had problems paying for prescription drugs* Problem paying for prescription drugs No problem paying for prescription drugs 84% ‡ 15% ‡ DK/RF, 1% Unweighted N=101 Weighted N=1,171 Note: Percentages may not add up to 100% due to rounding and/or missing information. *People were asked whether there was a time in the past 12 months when they did not have enough money to fill a prescription for medicine. ‡ This percentage is based on fewer than 20 respondents (Unweighted N<20) and should be interpreted with caution. Source: AdvantAge Initiative Community Survey in Indiana 2008
Figure 20.1, Indiana-Gary Midtown NNORC Percentage of people age 60+ who had problems paying for dental care or eyeglasses* Problem paying for dental care or eyeglasses 21% No problem paying for dental care or eyeglasses 79% DK/RF, 1% ‡ Unweighted N=101 Weighted N=1,171 Note: Percentages may not add up to 100% due to rounding and/or missing information. *People were asked whether there was a time in the past 12 months when they did not have enough money to obtain dental care (including checkups) and whether there was a time in the past 12 months when they did not have enough money to obtain eyeglasses. ‡ This percentage is based on fewer than 20 respondents (Unweighted N<20) and should be interpreted with caution. Source: AdvantAge Initiative Community Survey in Indiana 2008
Figure 21.1, Indiana-Gary Midtown NNORC Percentage of people age 60+ who know whether palliative care services are available* Don’t know if service available 30% Yes, service available 58% Not available 12% ‡ Unweighted N=101 Weighted N=1,171 Note: Percentages may not add up to 100% due to rounding and/or missing information. *People were asked whether end of life or hospice care service is available in their area. ‡ This percentage is based on fewer than 20 respondents (Unweighted N<20) and should be interpreted with caution. Source: AdvantAge Initiative Community Survey in Indiana 2008
Figure 21.2, Indiana-Gary Midtown NNORC Percentage of people age 60+ who have used palliative care services* Have used 0.7% ‡ Have not used 99.3% Unweighted N=101 Weighted N=1,171 Note: Percentages may not add up to 100% due to rounding and/or missing information. *People were asked whether they had used end of life or hospice care in the last 12 months. ‡ This percentage is based on fewer than 20 respondents (Unweighted N<20) and should be interpreted with caution. Source: AdvantAge Initiative Community Survey in Indiana 2008
MAXIMIZES INDEPENDENCE Transportation is accessible and affordable • Figs. 22.1-22.3. Percentage of people age 60+ who have access to public transportation The community service system enables people to live comfortably and safely at home • Figs. 23.1-23.2. Percentage of people age 60+ with adequate assistance in activities of daily living (ADL) • Figs. 24.1-24.2. Percentage of people age 60+ with adequate assistance in instrumental activities of daily living (IADL) Caregivers are mobilized to complement the formal service system • Fig. 25.1. Percentage of people age 60+ who provide help to the frail or disabled • Fig. 26.1. Percentage of people age 60+ who get respite/relief from their caregiving activity
Figure 22.1, Indiana-Gary Midtown NNORC Percentage of people age 60+ who have access to public transportation* Yes, but too limited to be useful 2% Don’t know 3% ‡ No 7% ‡ ‡ Yes 88% Unweighted N=101 Weighted N=1,171 Note: Percentages may not add up to 100% due to rounding and/or missing information. *People were asked whether public transportation is available in their community. ‡ This percentage is based on fewer than 20 respondents (Unweighted N<20) and should be interpreted with caution. Source: AdvantAge Initiative Community Survey in Indiana 2008
Figure 22.2, Indiana-Gary Midtown NNORC Frequency of use of public transportation in the past two months* Two or more days/week 1% ‡ Never 86% About once/week ‡ 2% Once or twice/month ‡ 2% ‡ 10% Public transportation does not exist/DK/RF Unweighted N=101 Weighted N=1,171 Note: Percentages may not add up to 100% due to rounding and/or missing information. *People were asked how often they have used public transportation during the past two months. ‡ This percentage is based on fewer than 20 respondents (Unweighted N<20) and should be interpreted with caution. Source: AdvantAge Initiative Community Survey in Indiana 2008
Figure 22.3, Indiana-Gary Midtown NNORC Means of transportation used most frequently* Ride in a car 18% Drive a car 78% ‡ 4% Other** Unweighted N=101 Weighted N=1,171 Note: Percentages may not add up to 100% due to rounding and/or missing information. *People were asked which means of transportation they use most frequently. **Includes taxi, walk, special transportation, and other. ‡ This percentage is based on fewer than 20 respondents (Unweighted N<20) and should be interpreted with caution. Source: AdvantAge Initiative Community Survey in Indiana 2008
Figure 23.1, Indiana-Gary Midtown NNORC Percentage of people age 60+ with adequate assistance* in activities of daily living (ADL) 1 or more unmet need 7.2% All needs are met 6.6% 1+ADL 13.8% ‡ ‡ ‡ No limitations 86.2% Unweighted N=101 Weighted N=1,171 Note: Percentages may not add up to 100% due to rounding and/or missing information. *People were asked whether they need assistance with the following activities (ADLs): taking a bath or a shower, dressing, eating, getting in/out of bed/chair, using/getting to a toilet, getting around inside the home. Those who answered “yes” were asked whether they get enough assistance with these activities. ‡ This percentage is based on fewer than 20 respondents (Unweighted N<20) and should be interpreted with caution. Source: AdvantAge Initiative Community Survey in Indiana 2008
Figure 23.2, Indiana-Gary Midtown NNORC Percentage of people age 60+ who need assistance with each activity of daily living* Taking a bath or shower ‡ Getting in/out bed/chair ‡ Getting around the home ‡ ‡ Dressing Using/getting to the toilet ‡ Unweighted N=101 Weighted N=1,171 Eating *People were asked whether they have a problem or need help with each of the above activities. ‡ This percentage is based on fewer than 20 respondents (Unweighted N<20) and should be interpreted with caution. Source: AdvantAge Initiative Community Survey in Indiana 2008
Figure 24.1, Indiana-Gary Midtown NNORC Percentage of people age 60+ with adequate assistance* in instrumental activities of daily living (IADL) 1 or more unmet need 12.1% All needs are met 12.9% 1+IADL 25% ‡ ‡ No limitations 75% Unweighted N=101 Weighted N=1,171 Note: Percentages may not add up to 100% due to rounding and/or missing information. *People were asked whether they need assistance with the following activities (IADLs): going outside the home, doing light housework, preparing meals, driving a car/using public transportation, taking the right amount of prescribed medication, keeping track of money and bills. Those who answered “yes” were asked whether they get enough assistance with these activities. ‡ This percentage is based on fewer than 20 respondents (Unweighted N<20) and should be interpreted with caution. Source: AdvantAge Initiative Community Survey in Indiana 2008
Figure 24.2, Indiana-Gary Midtown NNORC Percentage of people age 60+ who need assistance with each instrumental activity of daily living* Driving or public transportation ‡ Doing light housework ‡ Taking the right amount of medication ‡ Going outside the home ‡ Keeping track of money or bills ‡ Unweighted N=101 Weighted N=1,171 ‡ Preparing meals *People were asked whether they have a problem or need help with each of the above activities. ‡ This percentage is based on fewer than 20 respondents (Unweighted N<20) and should be interpreted with caution. Source: AdvantAge Initiative Community Survey in Indiana 2008
Figure 25.1, Indiana-Gary Midtown NNORC Percentage of people age 60+ who provide help to the frail or disabled* Provide care 24% Do not provide care 76% Unweighted N=101 Weighted N=1,171 Note: Percentages may not add up to 100% due to rounding and/or missing information. *People were asked whether they provide help or care, or arrange for help or care, for a relative or friend who is unable to do some things for him/herself due to illness or disability. Source: AdvantAge Initiative Community Survey in Indiana 2008
Figure 26.1, Indiana-Gary Midtown NNORC Percentage of people age 60+ who get respite/relief from their caregiving activity* DK/RF 3% ‡ No respite 30% ‡ Do not provide caregiving 76% Provide caregiving 24% Get respite 67% ‡ Unweighted N=101 Weighted N=1,171 Unweighted N=25 Weighted N=276 *People were asked whether they provide help or care, or arrange for help or care, for a relative or friend who is unable to do some things for him/herself due to illness or disability. *People were asked whether they get relief from their caregiving responsibilities. Note: Percentages may not add up to 100% due to rounding and/or missing information. ‡ This percentage is based on fewer than 20 respondents (Unweighted N<20) and should be interpreted with caution. Source: AdvantAge Initiative Community Survey in Indiana 2008
PROMOTES SOCIAL AND CIVIC ENGAGEMENT Residents maintain connections with friends and neighbors • Fig.27.1. Percentage of people age 60+ who socialized with friends or neighbors in the past week Civic, cultural, religious, and recreational activities include older residents • Fig. 28.1. Percentage of people age 60+ who attended church, temple, or other in the past week • Fig. 29.1. Percentage of people age 60+ who attended movies, sports events, clubs, or group events in the past week • Fig. 30.1. Percentage of people age 60+ who engaged in at least one social, religious, or cultural activity in the past week Opportunities for volunteer work are readily available • Fig. 31.1. Percentage of people age 60+ who participate in volunteer work Community residents help and trust each other • Figs. 32.1-32.2. Percentage of people age 60+ who live in “helping communities” Appropriate work is available to those who want it • Fig. 33.1. Percentage of people age 60+ who would like to be working for pay
Figure 27.1, Indiana-Gary Midtown NNORC Percentage of people age 60+ who socialized with friends or neighbors in the past week* Did not socialize 43% Socialized 57% Unweighted N=101 Weighted N=1,171 Note: Percentages may not add up to 100% due to rounding and/or missing information. *People were asked if they got together with friends or neighbors during the past week. Source: AdvantAge Initiative Community Survey in Indiana 2008
Figure 28.1, Indiana-Gary Midtown NNORC Percentage of people age 60+ who attended church, temple, or other in the past week* Did not attend 28% Attended 72% Unweighted N=101 Weighted N=1,171 Note: Percentages may not add up to 100% due to rounding and/or missing information. *People were asked if they went to church, temple, or another place of worship for services or other activities during the past week. Source: AdvantAge Initiative Community Survey in Indiana 2008
Figure 29.1, Indiana-Gary Midtown NNORC Percentage of people age 60+ who attended movies, sports events, clubs, or group events in the past week* Did not attend 49% Attended 51% Unweighted N=101 Weighted N=1,171 Note: Percentages may not add up to 100% due to rounding and/or missing information. *People were asked if they went to a movie, play, concert, restaurant, sporting event, club meeting, card game, or other social activity during the past week. Source: AdvantAge Initiative Community Survey in Indiana 2008
Figure 30.1, Indiana-Gary Midtown NNORC Percentage of people age 60+ who engaged in at least one social, religious, or cultural activity in the past week None 9% ‡ Engaged in one or more activity 91% Unweighted N=101 Weighted N=1,171 Note: Percentages may not add up to 100% due to rounding and/or missing information. ‡ This percentage is based on fewer than 20 respondents (Unweighted N<20) and should be interpreted with caution. Source: AdvantAge Initiative Community Survey in Indiana 2008
Figure 31.1, Indiana-Gary Midtown NNORC Percentage of people age 60+ who participate in volunteer work* Participate in volunteer work 41% Do not participate in volunteer work 59% Unweighted N=101 Weighted N=1,171 Note: Percentages may not add up to 100% due to rounding and/or missing information. *People were asked if they do volunteer work and if so what type of volunteer work they do. Source: AdvantAge Initiative Community Survey in Indiana 2008
Figure 32.1, Indiana-Gary Midtown NNORC Percentage of people age 60+ who live in “helping communities” ‡ ‡ ‡ ‡ ‡ ‡ Unweighted N=101 Weighted N=1,171 Most people in the neighborhood are basically honest and can be trusted If I have a problem there is always someone to help me in this neighborhood Most people in this neighborhood are willing to help if you need it Note: Percentages may not add up to 100% due to rounding and/or missing information. ‡ This percentage is based on fewer than 20 respondents (Unweighted N<20) and should be interpreted with caution. Source: AdvantAge Initiative Community Survey in Indiana 2008
Figure 32.2, Indiana-Gary Midtown NNORC Percentage of people age 60+ who live in “helping communities”* Number of statements about helping communities that people “Agreed” with** DK/RF Agreed with none ‡ 2% ‡ 2% Agreed with one 7% ‡ Agreed with three 69% Agreed with two 20% Unweighted N=101 Weighted N=1,171 Note: Percentages may not add up to 100% due to rounding and/or missing information. *People were asked whether they strongly agree, agree, disagree, or strongly disagree with the following 3 statements: “Most people in this neighborhood are basically honest and can be trusted”; “If I have a problem there is always someone to help me in this neighborhood”; “Most people in this neighborhood are willing to help if you need it.” **Percentage of people who “Agreed” includes those who said they “Strongly agree” and those who said they “Agree.” ‡ This percentage is based on fewer than 20 respondents (Unweighted N<20) and should be interpreted with caution. Source: AdvantAge Initiative Community Survey in Indiana 2008
Figure 33.1, Indiana-Gary Midtown NNORC Percentage of people age 60+ who would like to be working for pay* DK/RF 2% Would like to work for pay 25% ‡ Working part time 6% ‡ Not working 84% Working full time 9% Would not like to work for pay 73% ‡ Unweighted N=101 Weighted N=1,171 Unweighted N=87 Weighted N=988 *People were asked what their current employment status is. *People who were not working were asked whether they would like to be working for pay. Note: Percentages may not add up to 100% due to rounding and/or missing information. ‡ This percentage is based on fewer than 20 respondents (Unweighted N<20) and should be interpreted with caution. Source: AdvantAge Initiative Community Survey in Indiana 2008