Download
1 / 74
760 likes | 783 Views
Dive into spatial domain operations for enhancing digital images in this informative presentation based on the book Digital Image Processing. Learn about filter applications, transformation functions, histograms, and more.

E N D
CIS 601 Image ENHANCEMENT in the SPATIAL DOMAIN Dr. Rolf Lakaemper
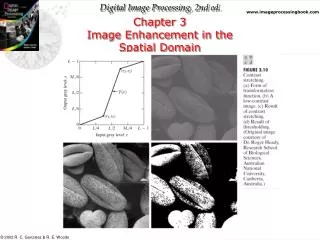
Most of these slides base on the book Digital Image Processing by Gonzales/Woods Chapter 3
Introduction • Image Enhancement ? • enhance otherwise hidden information • Filter important image features • Discard unimportant image features • Spatial Domain ? • Refers to the image plane (the ‘natural’ image) • Direct image manipulation
Remember ? A 2D grayvalue - image is a 2D -> 1D function, v = f(x,y)
Remember ? As we have a function, we can apply operators to this function, e.g. T(f(x,y)) = f(x,y) / 2 Operator Image (= function !)
Remember ? T transforms the given image f(x,y) into another image g(x,y) f(x,y) g(x,y)
Spatial Domain • The operator T can be defined over • The set of pixels (x,y) of the image • The set of ‘neighborhoods’ N(x,y) of each pixel • A set of images f1,f2,f3,…
Spatial Domain Operation on the set of image-pixels 6 8 2 0 3 4 1 0 12 200 20 10 6 100 10 5 (Operator: Div. by 2)
6 8 12 200 Spatial Domain Operation on the set of ‘neighborhoods’ N(x,y) of each pixel (Operator: sum) 6 8 2 0 226 12 200 20 10
Spatial Domain Operation on a set of images f1,f2,… 6 8 2 0 12 200 20 10 11 13 3 0 (Operator: sum) 14 220 23 14 5 5 1 0 2 20 3 4
Spatial Domain • Operation on the set of image-pixels • Remark: these operations can also be seen as operations on the neighborhood of a pixel (x,y), by defining the neighborhood as the pixel itself. • The simplest case of operators • g(x,y) = T(f(x,y)) depends only on the value of f at (x,y) • T is called a • gray-level or intensity transformation function
Transformations • Basic Gray Level Transformations • Image Negatives • Log Transformations • Power Law Transformations • Piecewise-Linear Transformation Functions • For the following slides L denotes the max. possible gray value of the image, i.e. f(x,y) [0,L]
Transformations Image Negatives: T(f)= L-f T(f)=L-f Output gray level Input gray level
Transformations Log Transformations: T(f) = c * log (1+ f)
Transformations Log Transformations InvLog Log
Transformations Log Transformations
Transformations Power Law Transformations T(f) = c*f
Transformations • varying gamma () obtains family of possible transformation curves • > 0 • Compresses dark values • Expands bright values • < 0 • Expands dark values • Compresses bright values
Transformations • Used for gamma-correction
Transformations • Used for general purpose contrast manipulation
Transformations Piecewise Linear Transformations
Piecewise Linear Transformations Thresholding Function g(x,y) = L if f(x,y) > t, 0 else t = ‘threshold level’ Output gray level Input gray level
Piecewise Linear Transformations • Gray Level Slicing • Purpose: Highlight a specific range of grayvalues • Two approaches: • Display high value for range of interest, low value else (‘discard background’) • Display high value for range of interest, original value else (‘preserve background’)
Piecewise Linear Transformations Gray Level Slicing
Piecewise Linear Transformations Bitplane Slicing Extracts the information of a single bitplane
Piecewise Linear Transformations BP 0 BP 5 BP 7
Piecewise Linear Transformations • Exercise: • How does the transformation function look for bitplanes 0,1,… ? • What is the easiest way to filter a single bitplane (e.g. in MATLAB) ?
Histograms Histogram Processing 1 4 5 0 3 1 5 1 Number of Pixels gray level
Histograms • Histogram Equalization: • Preprocessing technique to enhance contrast in ‘natural’ images • Target: find gray level transformation function T to transform image f such that the histogram of T(f) is ‘equalized’
Histogram Equalization Equalized Histogram: The image consists of an equal number of pixels for every gray-value, the histogram is constant !
Histogram Equalization Example: T We are looking for this transformation !
Histogram Equalization Target: Find a transformation T to transform the grayvalues g1[0..1] of an image I to grayvalues g2 = T(g1) such that the histogram is equalized, i.e. there’s an equal amount of pixels for each grayvalue. Observation (continous model !): Assumption: Total image area = 1 (normalized). Then: The area(!) of pixels of the transformed image in the gray-value range 0..g2 equals the gray-value g2.
Histogram Equalization • The area(!) of pixels of the transformed image in the gray-value range 0..g2 equals the gray-value g2. • Every g1 is transformed to a grayvalue that equals the area (discrete: number of pixels) in the image covered by pixels having gray-values from 0 to g1. • The transformation T function t is the area- integral: T: g2 = 0..g1I da
Histogram Equalization Discrete: g1 is mapped to the (normalized) number of pixels having grayvalues 0..g1 .
Histogram Equalization Mathematically the transformation is deducted by theorems in continous (not discrete) spaces. The results achieved do NOT hold for discrete spaces ! (Why ?) However, it’s visually close.
Histogram Equalization • Conclusion: • The transformation function that yields an image having an equalized histogram is the integral of the histogram of the source-image • The discrete integral is given by the cumulative sum, MATLAB function: cumsum() • The function transforms an image into an image, NOT a histogram into a histogram ! The histogram is just a control tool ! • In general the transformation does not create an image with an equalized histogram in the discrete case !
Operations on a set of images Operation on a set of images f1,f2,… 6 8 2 0 12 200 20 10 11 13 3 0 (Operator: sum) 14 220 23 14 5 5 1 0 2 20 3 4
Operations on a set of images Logic (Bitwise) Operations AND OR NOT
Operations on a set of images The operators AND,OR,NOT are functionally complete: Any logic operator can be implemented using only these 3 operators
Operations on a set of images Any logic operator can be implemented using only these 3 operators: Op= NOT(A) AND NOT(B) OR NOT(A) AND B
Operations on a set of images Image 1 AND Image 2 1 2 3 9 7 3 6 4 1 0 1 1 (Operator: AND) 2 2 2 0 1 1 1 1 2 2 2 2
Operations on a set of images Image 1 AND Image 2: Used for Bitplane-Slicing and Masking
Operations on a set of images Exercise: Define the mask-image, that transforms image1 into image2 using the OR operand 1 2 3 9 7 3 6 4 255 2 7 255 (Operator: OR) 255 3 7 255
Operations Arithmetic Operations on a set of images 1 2 3 9 7 3 6 4 2 3 4 10 (Operator: +) 9 5 8 6 1 1 1 1 2 2 2 2
Operations Exercise: What could the operators + and – be used for ?
Operations (MATLAB) Example: Operator – Foreground-Extraction
Operations (MATLAB) Example: Operator + Image Averaging
CIS 601 Image ENHANCEMENT in the SPATIAL DOMAIN Part 2
Histograms • So far (part 1) : • Histogram definition • Histogram equalization • Now: • Histogram statistics
Histograms Remember: The histogram shows the number of pixels having a certain gray-value number of pixels grayvalue (0..1)