Download
1 / 25
250 likes | 376 Views
Topic 21 Productivity. GEOL 2503 Introduction to Oceanography. Feeding Strategies. Primary producers —make food Photosynthesis Chemosynthesis Consumers —don’t make their own food Herbivores—eat plants Carnivores—eat meat Omnivores—eat both Decomposers —break down food by decay.

E N D
Topic 21Productivity GEOL 2503 Introduction to Oceanography
Feeding Strategies • Primary producers—make food • Photosynthesis • Chemosynthesis • Consumers—don’t make their own food • Herbivores—eat plants • Carnivores—eat meat • Omnivores—eat both • Decomposers—break down food by decay
Algae-supported biotic community Fig. 13.15
Trophic Level 5. Killer Whale 4. Seal 3. Bony Fish 2. Zooplankton Phytoplankton Energy 1 unit 10 100 10% efficiency 1,000 at each level 10,000 A Simple Food Chain Solar Energy 500,000 2% efficiency
CHARACTERISTICS OF ECOSYSTEMS With progress through an ecosystem: • 1. Biomass decreases • 2. Size of organisms increases • 3. Energy decreases • 4. Entropy (disorder) increases
Trophic Levels • Each level represents a link in the food chain • Primary producers are always the first trophic level • Herbivorous zooplankton are second level, etc.
TROPHIC PYRAMIDS • Trophic levels vary between 2 – 8 with average of 5 • Average efficiency about 10% for each level in the open ocean • Efficiency may be 15% near coasts and 20% in areas of upwelling
Where does all the energy go? • If only 10% of energy is harvested at each trophic level, where does the other 90% go? Energy is lost to excretion, metabolism (respiration), and decomposition when organisms die uneaten
Food Chains and Webs • Food chain implies linear relationship, but it is a much more complex interrelationship among organisms, called food web • primary producers primary consumers secondary consumers top carnivore • Example: organic molecules phytoplankton zooplankton anchovy tuna killer whale (decomposers)
A Food Web
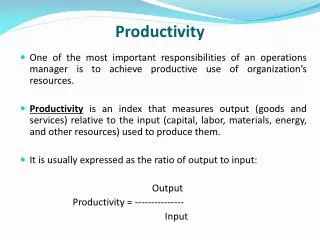
Productivity versus biomass • Biomass the mass of living material present at any time, expressed as grams per unit area or volume • Productivity is the rate of production of living material per unit time per unit area or volume
Biomass pyramid • Number of individuals and total biomass decrease at successive trophic levels • Organisms increase in size
Large carnivores like Toothed Whales, Seals & Sharks feed at top of food web Disadvantages – collapse of any trophic level affects all higher levels. Large prey less abundant than small prey. Advantage – larger prey provide more calories Baleen Whales feed low down on food web Disadvantage – must consume enormous volumes of small plankton Advantage – closer to energy source (less middle men) Different Feeding Strategies
Regional productivity summarized Fig. 13.14
Upwelling and nutrient supply Coastal upwelling brings nutrients and carbon dioxide up to the photic zone creating zones of high productivity
Contribution to the total world fishery by ecosystem • open ocean (3.8% of total) • B. upwellings (20.9% of total) • C. tropical shelves (21% of total) • D. non-tropical shelves (35.6% of total) • E. coastal and coral (18.7% of total)
A. Sunshine curve peaks during the summer months B. Phytoplankton curve reaches its highest peak in the spring C. Nutrients curve peaks during the winter. D. Zooplankton (grazers) curve peaks during the late spring, after microscopic plants, upon which they feed
The equation for photosynthesis 6 CO2+ 6 H2O C6H12O6+ 6O2 carbon dioxide + water + light energy glucose + oxygen
Animal Feeding Strategies • Heterotrophs • Herbivores – eat plants • Granivores – eat seeds • Frugivores – eat fruits • Foliovores – eat leaves • Carnivores – eat other animals • Piscivores – eat fish
Measuring Primary Productivity • Gross primary productivity -- total carbon fixed during photosynthesis • Net primary productivity -- total carbon fixed during photosynthesis minus that part which is respired (gives that part of the production available to higher trophic levels)