Download
1 / 31
310 likes | 479 Views
MiniBooNE. V th Rencontres du Vietnam 2004 David Schmitz Columbia University. Outline. MiniBooNE Motivation LSND Signal Interpreting the LSND Signal MiniBooNE Overview Experimental Setup Neutrino Events in the Detector The Oscillation Search

E N D
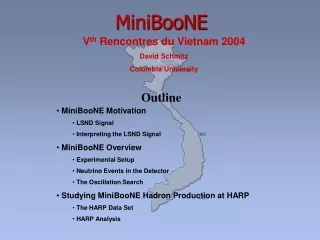
MiniBooNE Vth Rencontres du Vietnam 2004 David Schmitz Columbia University Outline • MiniBooNE Motivation • LSND Signal • Interpreting the LSND Signal • MiniBooNE Overview • Experimental Setup • Neutrino Events in the Detector • The Oscillation Search • Studying MiniBooNE Hadron Production at HARP • The HARP Data Set • HARP Analysis
MiniBooNE Motivation : The LSND Result • The Liquid Scintillator Neutrino Detector was the first accelerator based neutrino oscillation experiment to see a signal. • LSND saw a 3.8s excess (above expected background) of ne in a nm beam. combined analysis allowed region • The KARMEN experiment was a similar experiment that saw no signal neutrinos. KARMEN had less statistics and a slightly different experimental L/E. • A combined analysis of LSND and KARMEN leaves a substantial allowed region. David Schmitz – Columbia University
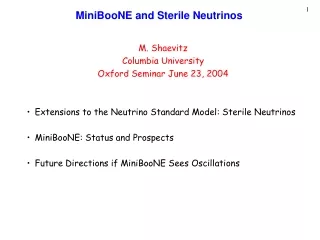
MiniBooNE Motivation : Interpreting the LSND Signal • What to make of 3 independent Dm2 values? • solar exp. (Super-K, K, SNO, KamLAND, …) Dm2 ~ 10-5 eV2 • atmospheric exp. (Super-K, K, …) Dm2 ~ 10-3 eV2 • accelerator exp. (LSND) Dm2 ~ 1 eV2 David Schmitz – Columbia University
MiniBooNE Motivation : Interpreting the LSND Signal • What to make of 3 independent Dm2 values? • solar exp. (Super-K, K, SNO, KamLAND, …) Dm2 ~ 10-5 eV2 • atmospheric exp. (Super-K, K, …) Dm2 ~ 10-3 eV2 • accelerator exp. (LSND) Dm2 ~ 1 eV2 • One of the experimental results is incorrect. Must verify each Dm2. • atmospheric and solar results are well confirmed. • accelerator and reactor based exp. in the atmo. and solar ranges (K2K, MINOS, KamLAND) • LSND requires confirmation. David Schmitz – Columbia University
MiniBooNE Motivation : Interpreting the LSND Signal • What to make of 3 independent Dm2 values? • solar exp. (Super-K, K, SNO, KamLAND, …) Dm2 ~ 10-5 eV2 • atmospheric exp. (Super-K, K, …) Dm2 ~ 10-3 eV2 • accelerator exp. (LSND) Dm2 ~ 1 eV2 • One of the experimental results is incorrect. Must verify each Dm2. • atmospheric and solar results are well confirmed. • accelerator and reactor based exp. in the atmo. and solar ranges (K2K, MINOS, KamLAND) • LSND requires confirmation. • Addition of 1 or more “Sterile” neutrinos to the 3 neutrino standard model. • LSND could be explained by oscillations to sterile neutrinos. David Schmitz – Columbia University
MiniBooNE Motivation : Interpreting the LSND Signal • What to make of 3 independent Dm2 values? • solar exp. (Super-K, K, SNO, KamLAND, …) Dm2 ~ 10-5 eV2 • atmospheric exp. (Super-K, K, …) Dm2 ~ 10-3 eV2 • accelerator exp. (LSND) Dm2 ~ 1 eV2 • One of the experimental results is incorrect. Must verify each Dm2. • atmospheric and solar results are well confirmed. • accelerator and reactor based exp. in the atmo. and solar ranges (K2K, MINOS, KamLAND) • LSND requires confirmation. ? • Addition of 1 or more “Sterile” neutrinos to the 3 neutrino standard model. • LSND could be explained by oscillations to sterile neutrinos. • Other possibilities • CPT violation • CP violation + sterile neutrinos • others… David Schmitz – Columbia University
MiniBooNE Motivation : Interpreting the LSND Signal • What to make of 3 independent Dm2 values? • solar exp. (Super-K, K, SNO, KamLAND, …) Dm2 ~ 10-5 eV2 • atmospheric exp. (Super-K, K, …) Dm2 ~ 10-3 eV2 • accelerator exp. (LSND) Dm2 ~ 1 eV2 • One of the experimental results is incorrect. Must verify each Dm2. • atmospheric and solar results are well confirmed. • accelerator and reactor based exp. in the atmo. and solar ranges (K2K, MINOS, KamLAND) • LSND requires confirmation. • Addition of 1 or more “Sterile” neutrinos to the 3 neutrino standard model. • LSND could be explained by oscillations to sterile neutrinos. The LSND signal must be confirmed or ruled out to know how to proceed in the neutrino sector. • Other possibilities • CPT violation • CP violation + sterile neutrinos • others… David Schmitz – Columbia University
MiniBooNE Overview : Experimental Setup Decay region 25 m 50 m 450 m • MiniBooNE receives 8.9 GeV/c protons from the Fermilab Booster. • Protons are focused onto a 1.7 interaction length beryllium target producing various secondaries (p’s, p’s, K’s). • Secondaries are focused via a magnetic focusing horn surrounding the target. The horn receives 170 kA pulses at up to 10 Hz. David Schmitz – Columbia University
MiniBooNE Overview : Experimental Setup Decay region 25 m 50 m 450 m • Secondary mesons (p’s, K’s) decay in the 50m decay region to produce the MiniBooNE neutrino beam. • A removable 25m absorber can be inserted. A great advantage for studying backgrounds. • The horn is capable of running with the polarity reversed…anti-neutrino mode. ( ) ( ) David Schmitz – Columbia University
MiniBooNE Overview : Experimental Setup Decay region 25 m 50 m 450 m • Neutrinos are detected ~500 m away in a 12 m diameter Čerenkov detector. • 950,000 liters of mineral oil • 1280 photomultiplier tubes • 240 optically isolated veto tubes David Schmitz – Columbia University
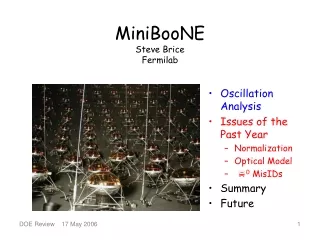
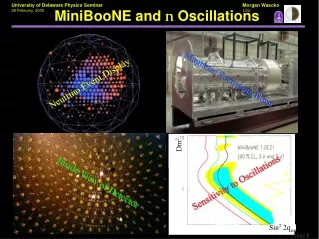
MiniBooNE Overview : Neutrinos in the Detector • We look for remnants of n CC events in the detector producing a ring of prompt Čerenkov light and a small amount of delayed scintillation light. • NC p0 events are characterized by the double rings produced by p0g g. These events can look like electron events when the photons overlap or the decay is asymmetric. David Schmitz – Columbia University
MiniBooNE Overview : More About CCQE Events • Reconstruct the lepton angle with respect to the beam direction. • Measure visible energy from Čerenkov light and small amount of scintillation light. • ~10% En resolution at 1GeV with no background David Schmitz – Columbia University
MiniBooNE Overview : More About CCQE Events • Reconstruct the lepton angle with respect to the beam direction. • Measure visible energy from Čerenkov light and small amount of scintillation light. • ~10% En resolution at 1GeV with no background nm CCQE Event Reconstruction PRELIMINARY PRELIMINARY PRELIMINARY David Schmitz – Columbia University
MiniBooNE Overview : nm neOscillation Sensitivity • Recall that the MiniBooNE ne appearance analysis is a blind analysis. • neCCQE events suffer from larger backgrounds than nmevents. • Use measurements both internal and external to constrain background rates. David Schmitz – Columbia University
MiniBooNE Overview : nm neOscillation Sensitivity • Recall that the MiniBooNE ne appearance analysis is a blind analysis. • neCCQE events suffer from larger backgrounds than nmevents. • Use measurements both internal and external to constrain background rates. • With 1x10²¹ protons on target • Average ~5% uncertainty on background rates. David Schmitz – Columbia University
MiniBooNE Overview : nm neOscillation Sensitivity • Recall that the MiniBooNE ne appearance analysis is a blind analysis. • neCCQE events suffer from larger backgrounds than nmevents. • Use measurements both internal and external to constrain background rates. • With 1x10²¹ protons on target • Average ~5% uncertainty on background rates. David Schmitz – Columbia University
SignalMis IDIntrinsic ne Dm2 = 1 eV2 Dm2 = 0.4 eV2 MiniBooNE Overview : nm neOscillation Signal David Schmitz – Columbia University
MiniBooNE Beam : Hadron Production at HARP MiniBooNE has cooperated with the HARP experiment (PS-214) at CERN to measure hadron production from the MiniBooNE beryllium target. • The first goal is to measure p+ production cross sections for Be at pproton = 8.9 GeV/c. • Additional measurements include: • p- production (important for n running) • K production (important for intrinsic ne backgrounds) David Schmitz – Columbia University
MiniBooNE Beam : Beryllium Target • The MB target is ~71 cm long and 1 cm in diameter • Cooling fins (also Be) • Comprised of seven ~10 cm slugs David Schmitz – Columbia University
HARP : Cross Section Measurement acceptance migration matrix pion purity pion yield tracking efficiency pion efficiency David Schmitz – Columbia University
HARP : Cross Section Measurement acceptance migration matrix pion purity pion yield tracking efficiency pion efficiency • Acceptance is determined using the MC (compare to MB requirements) David Schmitz – Columbia University
HARP : Cross Section Measurement acceptance migration matrix pion purity pion yield tracking efficiency pion efficiency • Acceptance is determined using the MC (compare to MB requirements) • Tracking Efficiency and Migration (no time to discuss today). David Schmitz – Columbia University
HARP : Cross Section Measurement acceptance migration matrix pion purity pion yield tracking efficiency pion efficiency • Acceptance is determined using the MC (compare to MB requirements) • Tracking Efficiency and Migration (no time to discuss today). • Raw Particle Yields and Efficiency and Purity of the selection. David Schmitz – Columbia University
MiniBooNE Beam : Relevant Phase Space Momentum distribution peaks at ~1.5 GeV/c and trails off at 6 GeV/c. Angular distribution of pions is mostly below 200 mrad. Acceptance in P for |qy|<50 mrad & |qx|<200 mrad Acceptance in qx for |qy|<50 mrad & P > 1 GeV Momentum and Angular distribution of pions decaying to a neutrino that passes through the MB detector. Acceptance of HARP forward detector David Schmitz – Columbia University
HARP Detector : Overlapping PID Detectors 0 1 2 3 4 5 6 7 8 9 10 P (GeV) CAL p/p TOF CERENKOV TOF ? p/k CERENKOV p/e TOF CERENKOV CALORIMETER CERENKOV David Schmitz – Columbia University
HARP Detector : Overlapping PID Detectors 0 1 2 3 4 5 6 7 8 9 10 P (GeV) CAL p/p TOF CERENKOV TOF ? p/k CERENKOV p/e TOF CERENKOV CALORIMETER CERENKOV David Schmitz – Columbia University
HARP Detector : Overlapping PID Detectors 0 1 2 3 4 5 6 7 8 9 10 P (GeV) CAL p/p TOF CERENKOV TOF ? p/k CERENKOV p/e TOF CERENKOV CALORIMETER CERENKOV Bayes Theorem David Schmitz – Columbia University
HARP Detector : Overlapping PID Detectors 0 1 2 3 4 5 6 7 8 9 10 P (GeV) CAL p/p TOF CERENKOV TOF ? p/k CERENKOV p/e TOF CERENKOV CALORIMETER CERENKOV momentum distribution calorimeter tof cerenkov David Schmitz – Columbia University
Pion ID : Beam Particles • Use no target runs to determine correction factor for PID. Beam detector ID is considered “true” ID. • PID Input (for 1st iteration) is found from crude cuts on detector data. But method is quite insensitive to starting input. • Need MC to determine efficiency and purity for continuous p, q PRELIMINARY PRELIMINARY PRELIMINARY David Schmitz – Columbia University
Pion ID : Beryllium 5% Target • Run iterative PID algorithm on Be 5% target data to extract raw pion yields. • PID efficiency and purity determined using no target data (MC). • Tracking efficiency determined using both data and MC. • Acceptance determined from the MC. PRELIMINARY PRELIMINARY David Schmitz – Columbia University
Next Steps • Continue to improve particle probability functions for the three detectors using data and MC. • Implement tracking, PID, and acceptance corrections to raw particle yields. • Move towards normalized pion cross section measurement. Next Next Steps • Study pion absorption and reinteraction effects in the thick target by using data from three different target lengths. • How well can we do p/K separation? • Finally, generate neutrino fluxes for MiniBooNE using measurements from HARP. David Schmitz – Columbia University