Download
1 / 32
320 likes | 454 Views
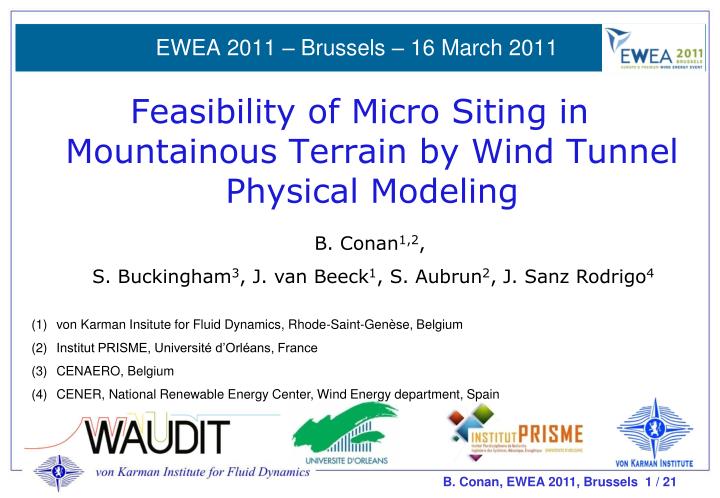
EWEA 2011 – Brussels – 16 March 2011. Feasibility of Micro Siting in Mountainous Terrain by Wind Tunnel Physical Modeling. B. Conan 1,2 , S. Buckingham 3 , J. van Beeck 1 , S. Aubrun 2 , J. Sanz Rodrigo 4. von Karman Insitute for Fluid Dynamics, Rhode-Saint-Genèse, Belgium

E N D
EWEA 2011 – Brussels – 16 March 2011 Feasibility of Micro Siting in Mountainous Terrain by Wind Tunnel Physical Modeling B. Conan1,2, S. Buckingham3, J. van Beeck1, S. Aubrun2, J. Sanz Rodrigo4 • von Karman Insitute for Fluid Dynamics, Rhode-Saint-Genèse, Belgium • Institut PRISME, Université d’Orléans, France • CENAERO, Belgium • CENER, National Renewable Energy Center, Wind Energy department, Spain
The WAUDIT project • Wind Resource Assessment Audit and Standardization European Commission Marie-Curie Initial Training Networks Pool of 18 PhD FP7-PEOPLE-ITN-2008
Physical modeling of atmospheric flows Pedestrian comfort: European parliament Aerodynamic design of the Belgium polar station Wind loading on buildings Pollution dispersion
Physical modeling assumptions • Modeling requirements (N-S equations): • undistorted scaling geometry • equal dimensionless inflow conditions • Ri (Richardson) • Ec (Eckert) • Pr (Prandtl): same fluid • Ro (Rossby): Coriolis effect neglected in the near surface • Re (Reynolds): cannot be conserved • Ensure fully turbulent state: Re > 10 000 • Minimum roughness Reynolds number: • Reynolds number dependency study if possible cst. temp. wind tunnel neutral stratification
Modeling assumptions • Modeling questions common to CFD and physical modelers: • reproduction of atmospheric inflow conditions • choice of the modeling area • choice of surface roughness / wall function • integration of the model in the domain • Specific topics for physical modeling: • Re number dependency • high scaling factors • choice of the measurement techniques
CENER - Test Case • Alaiz mountain, Pamplona, Spain: • 1 130 m high (600 m) • very complex terrain • steep slopes • dominant North wind • upstream ridge > 200m
CENER - Test Case • Mock-up in the wind tunnel: • 1 / 5000 scale (2.8 m wide x 3 m long) • one direction tested • Model realized by UPM (Universidad politechnica de Madrid, Spain)
Modeling inlet conditions • Parameters to reproduce: • velocity profile • roughness length ( ) • friction velocity ( )
Modeling inlet conditions • ABL generation: • grid • fence • adaptative roughness elements
Modeling inlet conditions • Parameters to reproduce: • velocity profile • roughness length ( ) • friction velocity ( ) • turbulent profiles (3 components) • turbulent spectra • Need for 3 components time resolved measurements
Modeling inlet conditions • Triple hot-wire probe • punctual measurement • U, V, W, u, v, w, u’, v’, w’ • Iu, Iv, Iw • TKE • shear stress:
Modeling inlet conditions • Alaiz inlet conditions: Wind tunnel can model different roughness length and scales Inflow reproduction challenging at very high scaling factor
Particle Image Velocimetry (PIV) • 2D instantaneous velocity field (U, W) • high spacial resolution: 150mm x 150mm with 2mm = 10m resolution • 500 images to perform averaging
Particle Image Velocimetry (PIV) • Averaged fields: • velocity field • turbulence intensity • velocity vector • Instantaneous fields: • velocity field • shear stress • vorticity • vortex detection
Complementary measurement techniques Measurement error: Measurement error : PIV: 1.5% HW: 2% Statistical error: Averaged quantities: PIV: 1.5% (95% c.l.) HW: 1% (95% c.l.) Fluctuating quantities: PIV: 8% (95% c.l.) HW: 6% (95% c.l.) • PIV: • space resolution • 2 components • Hot-wire: • time resolution • 3 components High wind potential areas detection by PIV Fine characterization of the wind profile with triple hot-wire
Flow around the mountain • Velocity field: • speed-up at the top of the mountain • Turbulence intensity: • inlet perturbation • influence at mountain’s top • Velocity vector field: • perturbation of the inlet velocity profile • speed-up at mountain’s top
Flow around the mountain • Fractional Speed-up Ratio at 90m (FSR): Reference velocity Max speed up Recovery from the influence of the ridge Speed-down due to the mountain
Flow around the mountain • Comparison 2D CFD simulation: From: D. Munoz-Esparza et al. EWEA 2011, PO. 218 50% speed-up at the mountain’s top High influence of the front ridge
Conclusions and future investigations • Inflow conditions modeling: • the wind tunnel can model different ABL, it is more challenging at very high scaling factors. • characterization of all the inlet conditions possible to model in the wind tunnel. • Choice of the modeling area: • a ridge of 1/3 of the main mountain height and situated 4km upstream influences a lot the FSR. • parametric study with simplified geometries
Conclusions and future investigations • Measurement techniques: • combination of PIV and triple hot-wire very powerful. • implementation of Stereoscopic PIV (2D-3C) on Bolund • Remaining questions: • model roughness implementation Alaiz • comparison with field data Alaiz • Reynolds number dependency • Quantification of the influence of each parameter
Thank you for your attention References: [1]. Cermak, J.E. “Laboratory simulation of the Atmospheric Boundary Layer” AIAA Journal vol. 9 num. 9 pp1746-1754 (1971). [2]. Sanz Rodrigo, J., Van Beeck, J. and Dezsö Weidinger, G. “Wind tunnel simulation of 1the wind conditions inside bidimensional forest clear-cuts. Application to wind turbine siting” J. Wind Eng. Ind. Aerodyn. 95(7)609-634, 2007. [3]. Siddiqui, K., Hangan, H., Rasouli, A. “PIV technique implementation for wind mapping in complex topographies” Meas. Sci. Technol. 19 (2008) 065403 doi:10.1088/0957-0233/19/6/065403. [4]. ESDU Engineering Science Data Unit. Characteristics of atmospheric turbulence near the ground. 1985. [5]. VDI-guidelines 3783/12, 2000. Physical modelling of flow and dispersion processes in the atmospheric boundary layer – application of wind tunnels. Beuth Verlag, Berlin [6]. Raffel, M., Willert, C., Wereley, S. “Particle Image Velocimetry: a practical guide” Springer Verlag, 2007 [7]. Bruun, H.H., ”Hot-wire anemometry” Oxford University Press Oxford (2002) ISBN: 0198563426
The WAUDIT project • Wind Resource Assessment Audit and Standardization EU program: Marie-Curie Initial Training Networks Action FP7-PEOPLE-ITN-2008 • Scientific/Technical: Advance the state-of-the-art on wind assessment • Academic: Provide a multidisciplinary education around wind energy with specialization on wind resource assessment (18 PhDs)
Back-up • Modeling requirements (N-S equations):
Back-up • Pressure gradient • Fully developed flow • Two profiles at X and X+2m
Back-up Calibration with a 4th polynomial: Velocity components in the frame of the wires: Velocity in wind tunnel frame:
Modelling boundary conditions Velocity in wind tunnel frame:
Back-up Measurement error: Measurement error : PIV: 1.5% HW: 2% Statistical error: Averaged quantities: PIV: 1.5% (95% c.l.) HW: 1% (95% c.l.) Fluctuating quantities: PIV: 8% (95% c.l.) HW: 6% (95% c.l.) • PIV: • space resolution • 2 components • Hot-wire: • time resolution • 3 components High wind potential areas detection by PIV Fine characterization of the wind profile with triple hot-wire
Back-up Assessment of wind potential in complex terrain with high accuracy • field measurements: reality, but long, expensive and low resolution • linear models: limited to slopes < 30% • numerical simulation: (main area of research) high resolution, controlled boundary conditions, modeling all scales but also high level of modeling: need for precise validation Wind tunnel modeling: • constant conditions • space and temporal resolution • moderated level of modeling • Example on a mountainous terrain