Download
1 / 26
260 likes | 406 Views
Programs. Infrastructure Flood Control Repairs to Storm Drains Stream Projects. Strategic Investments Neighborhood Projects Transportation Projects Transit Economic Development. Programs. Water Quality Pollution Control Stream Restoration. Operating NPDES permit

E N D
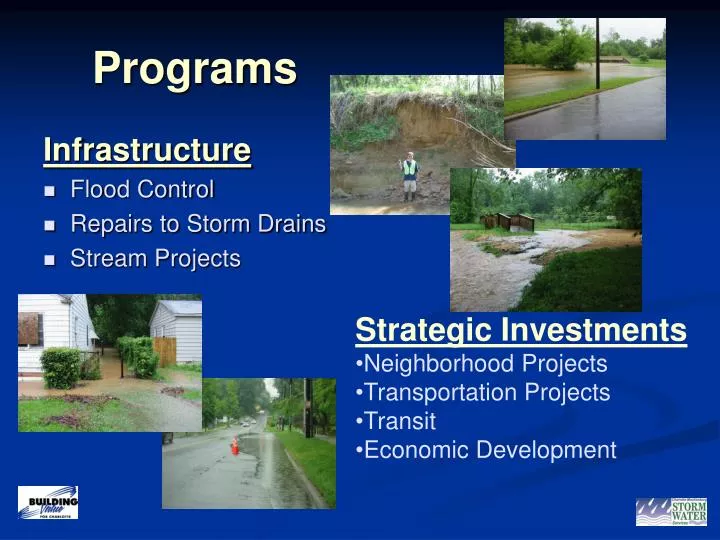
Programs Infrastructure • Flood Control • Repairs to Storm Drains • Stream Projects • Strategic Investments • Neighborhood Projects • Transportation Projects • Transit • Economic Development
Programs Water Quality • Pollution Control • Stream Restoration • Operating • NPDES permit • Customer Service • Finances
FY2008 Storm Water Services Program Highlights • Capital Program - $33.5 million • Neighborhood-wide projects (50%) • Repairs (29%) • Water Quality (12%) • Strategic Collaboration (9%) • Operating Plan - $12.6 million • NPDES Work Plan • PCCO • Street Maintenance
FY2008 Storm Water Services Program Highlights • Fee Drivers • Capital projects (catching up with aging infrastructure) • Increased construction costs • Steady influx of requests for service • Less reliance on bond revenue • Long Range Fee Plan • Declining rate increases
Long Term Plan • 1993 – 2007 • 10% increases to complete high priority maintenance backlog • 7.5% increases through FY06 to continue aggressive attack on the channels and large projects • 2008 forward • 7% increases thru FY10 • Stepping down increases to cost of living
Monthly Residential Fees $8.90 FY08$5.51 $2.12
Consolidated Information FY03FY04FY05FY06FY07 Requests For Service Qualified 1,749 1,201 1,206 1,063 1,289 Resolved 1,059 1,875 1,863 1,673 690 Outstanding 7,697 7,023 6,366 5,756 6,505 Fees Increases 5.5% 7.5% 7.5% 7.5% 7.0% Residents > 2,000 sf $3.87 $4.16 $4.47 $4.81 $5.15 Capital Program Expenditures $16.1 $32.4 $37.9 $36.8 $32.5 PAYG Funding $16.4 $ 6.3 $ 9.4 $11.8 $14.0 Debt Funding $54.3 $45.0 Fund Balance $19.5 ($6.6) $20.0 ($4.9) $21.6 Outstanding Debt $52.8 $106.2 $104.1 $144.5
Consolidated Information FY08FY09FY10FY11FY12 Requests For Service Qualified 1,280 1,280 1,280 1,280 1,280 Resolved 540 540 540 540 632 Outstanding 7,254 8,003 8,752 9,596 10,248 Fees Increases 7.0% 7.0% 7.0% 6.5% 6.0% Residents > 2,000 sf $5.51 $5.89 $6.31 $6.72 $7.12 Capital Program ($mm) Expenditures $33.5 $34.5 $35.5 $36.6 $37.7 PAYG Funding $17.0 $18.0 $18.5 $19.0 $20.0 Debt Funding $30.0 $30.0 Fund Balance $ 6.2 $21.0 $ 5.1 $18.5 $ 2.3 Outstanding Debt $141.1 $166.7 $162.1 $187.8 $183.6
Fort Collins, CO Portland, OR Austin, TX Boulder, CO Chattanooga, TN Tampa, FL Durham Raleigh Wilmington Charlotte High Point Fayetteville Winston-Salem Greensboro Black & Veatch 2004/2005 Stormwater Survey Informal survey facilitated by Scott Bryant, Greensboro, NC
Engineering Team • Team Leader • 2 Watershed Area Managers • 1 Senior Project Manager • 10 Project Managers • 2 Project Coordinators • 1 Construction Manager • 2 Senior Construction Inspectors • 4 Construction Inspectors
Engineering Team Responsibilities • Provide Project Management, Construction Management and Inspection on 21 Flood Control Projects, 8 Stream Restoration and 11 Water Quality/ Pollution Control Projects • Provide Technical Support to Transportation and Neighborhood Improvement Programs • Provide Project Management on Transit driven projects • Review Rezoning Requests • Review & approve Fee Credits • Interface with City Council on Floodplain Regulations • Establish, Maintain & Update Policies, Procedures, Storm Drainage Design Manual & Fee Credit Manual • Manage the storm water economic development program
Flood Control Program • Flood control projects are watershed-wide drainage system improvements, system problems and solutions are inter-connected and drain up to one square mile. • Typical planning, design and construction duration – 5-7 years • Typical costs range from $500,000 - $10,000,000 • Annual Funding of $17,304,000
Flood Control Program • Completed around 60 projects • Currently working on 21 flood control projects (at various phases) • Backlog of 58 identified project areas • 1993 – present: Flood Control Projects defined by density of service requests and assessment by Storm Water Inspector & Engineer. • Watershed Priority Ranking efforts becoming more proactive. • Perform approximate modeling to determine street and house flooding • Number of Backlog projects will likely increase
Strategic Investment Programs • Collaboration with various City Programs where we provide technical support and funding • Neighborhood Projects - $515,000 • Transportation Projects - $515,000 • Transit - $1,081,500 • Economic Development - $515,000
NPDES Permit Program • Charlotte Phase 1 MS4 -1993 • Partnered w/County since that time • Recent permit renewal • Six minimum measures Some city, some shared • City staff are permit managers • S&EC City, separate division • Education/volunteer program elements, shared • Monitoring, IDDE, Contracted to Meck Co. • Good Housekeeping, shared • PCCO – City
WQ/Stream Monitoring Network County doing or shall we?
Impaired Streams • Causes of impairment • TMDL’s written for most • NPDES permit requires “Water Quality Recovery Program” • $1 Billion backlog (only WQ) • CWA holds us responsible
NPDES - PCCO Highlights • Currently proposed for City and ETJ • Proposal goes beyond mandated minimums • Adds controls for Flooding /erosion reduction • Adds open space requirements • Includes redevelopment provisions – 303d recovery • Addresses issues related to endangered mussel • Includes several fee-in-lieu options (non-flood) • Controversial
Reversing ImpairmentWQ Capital Program • Conduct restoration activities - Eteam • Not required, yet • Stream Restoration • BMP projects • Inside CIPs • Partnerships w/schools, parks, ED, County • Pond program • Watershed restoration projects – SR & BMP
Innovative Programs • BMP testing program • Construct and monitor a range of structural BMP’s • Supports successful protection measures • Supports restoration efforts • Benchmarks costs and effectiveness • http://stormwater.charmeck.org - professionals • Watershed monitoring/research projects • Edwards Branch • Beaverdam Creek
Permitting Program and the Stream Mitigation Bank • 401/404 permitting for City projects • Heavy use of consultants • Permitted XXX projects per year • 2003 - First Stream Mitigation Bank • Stream projects are ‘banked’ through credit system • Offsets impacts of other City projects (airport) • Allows us to keep restoration benefits local, rather than pay to state • Reduces the cost of restoration, 303d • Vegetation management for all projects
City WQ Budget • About $2M operating • Pays for County services • 10 Internal staff • Education and global planning • Excludes S&EC staff (10 inspectors) • About $4M Capital • Funds named projects, < 1 sq mi. • 11% of total City CIP • Shared between SR, Pond, BMP projects • Excludes grant funds • Excludes revenue from mitigation bank sales