Download

1 / 17
190 likes | 475 Views
Sensitivity Analysis. Jake Blanchard Fall 2010. Introduction. Sensitivity Analysis = the study of how uncertainty in the output of a model can be apportioned to different input parameters

E N D
Sensitivity Analysis Jake Blanchard Fall 2010
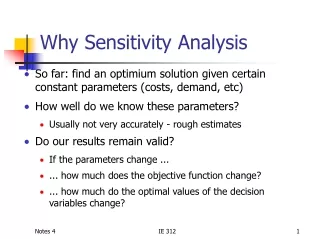
Introduction • Sensitivity Analysis = the study of how uncertainty in the output of a model can be apportioned to different input parameters • Local sensitivity = focus on sensitivity at a particular set of input parameters, usually using gradients or partial derivatives • Global or domain-wide sensitivity = consider entire range of inputs
Typical Approach • Consider a Point Reactor Kinetics problem
Results • P(t) normalized to P0 • Mean lifetime normalized to baseline value (0.001 s) • t=3 s
Results • P(t) normalized to P0 • Mean lifetime normalized to baseline value (0.001 s) • t=0.1 s
Quantifying Sensitivity • To first order, our measure of sensitivity is the gradient of an output with respect to some particular input variable. • Suppose all variables are uncertain and • Then, if inputs are independent,
Quantifying Sensitivity • Most obvious calculation of sensitivity is • This is the slope of the curves we just looked at • We can normalize about some point (y0)
Quantifying Sensitivity • This normalized sensitivity says nothing about the expected variation in the inputs. • If we are highly sensitive to a variable which varies little, it may not matter in the end • Normalize to input variances
A Different Approach • Question: If we could eliminate the variation in a single input variable, how much would we reduce output variation? • Hold one input (Px) constant • Find output variance – V(Y|Px=px) • This will vary as we vary px • So now do this for a variety of values of px and find expected value E(V(Y|Px)) • Note: V(Y)=E(V(Y|Px))+V(E(Y|Px))
Now normalize • This is often called the • importance measure, • sensitivity index, • correlation ratio, or • first order effect
Variance-Based Methods • Assume • Choose each term such that it has a mean of 0 • Hence, f0 is average of f(x)
Variance Methods • Since terms are orthogonal, we can square everything and integrate over our domain
Variance Methods • Si is first order (or main) effect of xi • Sij is second order index. It measures effect of pure interaction between any pair of output variables • Other values of S are higher order indices • “Typical” sensitivity analysis just addresses first order effects • An “exhaustive” sensitivity analysis would address other indices as well
Suppose k=4 • 1=S1+S2+S3+S4+S12+S13+S14+S23+S24+S34+S123+S124+S134+S234+S1234 • Total # of terms is 4+6+4+1=15=24-1