Download
1 / 17
170 likes | 201 Views
Learn how variance and standard deviation measure data spread and represent numerical differences between data sets. Calculations, significance, and real-world examples included.

E N D
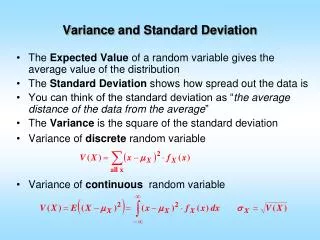
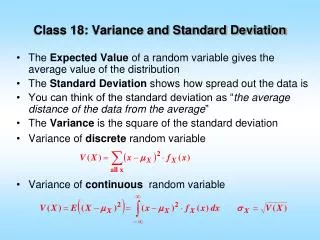
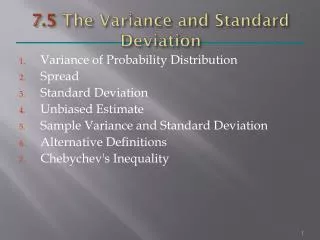
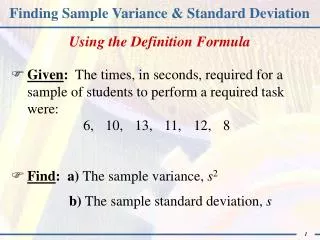
Variance: a measure of how data points differ from the mean • Data Set 1: 3, 5, 7, 10, 10 Data Set 2: 7, 7, 7, 7, 7 What is the mean and median of the above data set? Data Set 1: mean = 7, median = 7 Data Set 2: mean = 7, median = 7 But we know that the two data sets are not identical! The variance shows how they are different. We want to find a way to represent these two data set numerically.
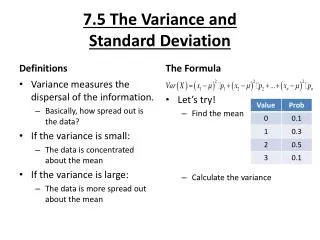
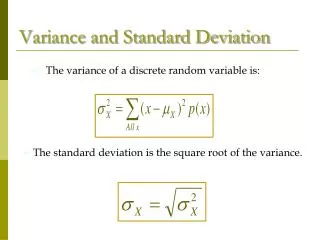
How to Calculate? • If we conceptualize the spread of a distribution as the extent to which the values in the distribution differ from the mean and from each other, then a reasonable measure of spread might be the average deviation, or difference, of the values from the mean.
Although this might seem reasonable, this expression always equals 0, because the negative deviations about the mean always cancel out the positive deviations about the mean. • We could just drop the negative signs, which is the same mathematically as taking the absolute value, which is known as the mean deviations. • The concept of absolute value does not lend itself to the kind of advanced mathematical manipulation necessary for the development of inferential statistical formulas. • The average of the squared deviations about the mean is called the variance. For population variance For sample variance
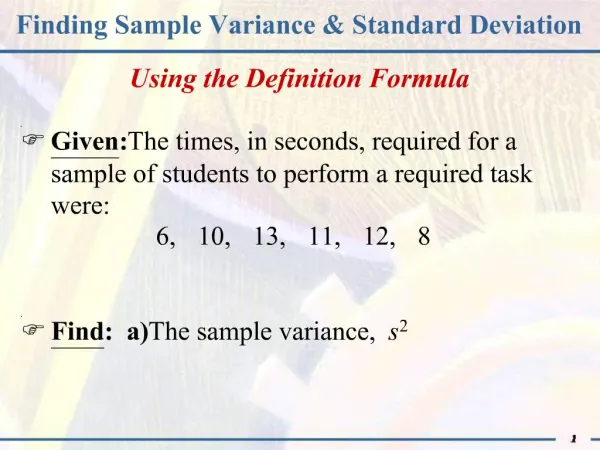
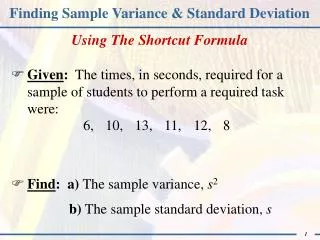
Example 2 Dive Mark Myrna 1 28 27 2 22 27 3 21 28 4 26 6 5 18 27 Find the mean, median, mode, range? mean 23 23 median 22 27 range 10 22 What can be said about this data? Due to the outlier, the median is more typical of overall performance. Which diver was more consistent?
Mark’s Variance = 64 / 5 = 12.8 Myrna’s Variance = 362 / 5 = 72.4 Conclusion: Mark has a lower variance therefore he is more consistent.
standard deviation - a measure of variation of scores about the mean • Can think of standard deviation as the average distance to the mean, although that's not numerically accurate, it's conceptually helpful. All ways of saying the same thing: higher standard deviation indicates higher spread, less consistency, and less clustering. • sample standard deviation: • population standard deviation:
Another formula • Definitional formula for variance for data in a frequency distribution • Definitional formula for standard deviation for data in a frequency distribution
round-off rule – carry one more decimal place than was present in the original data Variance = S2 = 362 / 5 = 72.4 Standard Deviation = 72.4 = 8.5
Bell shaped curve • empirical rule for data (68-95-99) - only applies to a set of data having a distribution that is approximately bell-shaped: (figure pg 220) • 68% of all scores fall with 1 standard deviation of the mean • 95% of all scores fall with 2 standard deviation of the mean • 99.7% of all scores fall with 3 standard deviation of the mean