Download
1 / 21
210 likes | 387 Views
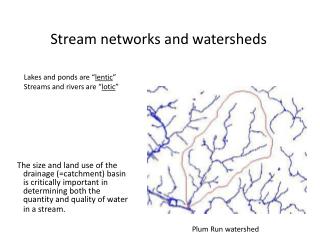
Stream Monitoring of Selected Sub-watersheds of Conesus Lake. Control Watersheds. North McMillan. Long Point. Sutton Point. Experimental Watersheds. Graywood. Sand Point. Cottonwood. Southwest. Stream Monitoring Overview. Discharge Water Chemistry.

E N D
Stream Monitoring of Selected Sub-watersheds of Conesus Lake
Control Watersheds North McMillan Long Point Sutton Point
Experimental Watersheds Graywood Sand Point Cottonwood Southwest
Stream Monitoring Overview • Discharge • Water Chemistry Combine Discharge and Chemistry to get Mass Losses from each Watershed to Conesus Lake
Stream Monitoring Overview • Discharge • Continually monitor stream level • combined with velocity and cross-sectional area to calculate continuous discharge • Water Chemistry • Phosphorus, Nitrogen, Suspended Solids, and Sodium • Non-event conditions - weekly • Event conditions - as they occur
Overview to date: • 16 months of continuous discharge, weekly baseline sampling on 7 streams • 21 events sampled automatically • 714 Water samples delivered to the laboratory • 4246 Water quality analyses completed • Data continuously disseminated via web site
Initial attempts at BMP Evaluations September to December for each year
Conclusions • Rating curves in place for the 7 streams • Year 1 discharge and loading summarized • Stream monitoring to continue • The year 1 data is low – may be troublesome • Begin to build tools to evaluate the impact of the implementation of BMP’s • More data / time is needed to evaluate the success of the BMP’s