Download
1 / 18
180 likes | 322 Views
Examples of European ecosystem accounts & calculation of carbon balance. Emil Ivanov, Centre for Environmental Management, University of Nottingham, UK Previously EEA/ETC LUSI, Barcelona, ES. EEA, 11 th of May 2011. Introduction Applying the ecosystem cube

E N D
Examples of European ecosystem accounts&calculation of carbon balance Emil Ivanov, Centre for Environmental Management, University of Nottingham, UK Previously EEA/ETC LUSI, Barcelona, ES EEA, 11th of May 2011
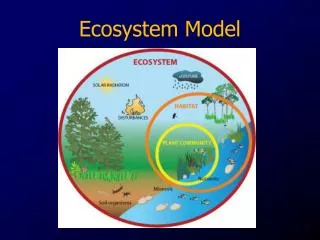
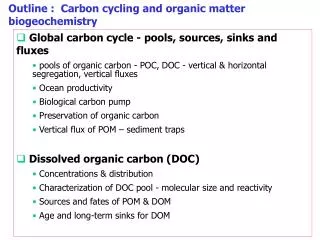
Introduction Applying the ecosystem • cube • Ecosystem richness, vitality and resilience = integrity or “health” • Main objective of Ecosystem capital accounting - bring together evidence on large scales from statistics (FAO…), remote sensing (medium resolution) and expert valuations (IUCN, Birdlife International, WDPA) • And analyse bio-geographical and landscape patterns
Illustrating two facets of ecosystem “cube” for Europe FAO statistics Soil map NPP – NDVI - T Land Cover Transport networks Protected areas Land cover
Illustration of Bio-productivity existing stock and new resource production in year 2000 • Addresses the ecosystem processes (not geological) • Downscaled FAO forest biomass + topsoil • Harmonized EU map • Underestimation of real stocks (no herbal and bush biomass included) • Key ecosystem processes as productivity or vitality (Rapport) • GEOSUCCESS NPP – C fix model + Night T = adapted to NEP • Harmonized EU map • Underestimation (no production under plastic or under forest canopy …)
Illustration of Bio-productivity human use in 2000 and resulting balance • Addresses what people take from the Ecosystem, renewable resources incl.both annual production and accumulated stock (food, fibre, materials, bio-fuels, NO fossil fuels) • FAO statistics downscaled on LC and NDVI • Harmonized EU view, calibration needed for different crops, tree types etc • Balance between the Ecosystem carbon stock added to annual carbon resource production and the human use of both • Approximates the amount of how much natural production people used and how much they shared with the rest of the ecosystem • it is not a balance between C-fixing and C-release
CALCULATING and MAPPINGNECB Used inputs: • FAO’s country statistics on: crop harvest, roundwood removals, grazing animals distribution, forest above-ground and bellow-ground biomass all for year 2000 • Remote sensing input (1 km grid): NPP 2000, NDVI 1999 – 2000, Tmin 2000 • Percentage Land cover in 1 km – selected classes croplands, forest lands and grazed lands • Soil carbon content map
CARBON STOCK IN FOREST + CARBON STOCK IN TOPSOIL Downscaled FAO data JRC data On % standing forest land in 1 km2 …
ADJUSTED NET PRIMARY PRODUCTION for year 2000 TOTAL RETURNS in year 2000 + GEOSUCCESS NPP Night Temperature adjustment Residuals from crops, timber and manure
DOWNSCALED CROPS year 2000 + DOWNSCALED GRAZED BIOMASS year 2000 + DOWNSCALED TIMBER year 2000 On % agriculture in 1 km grid FAO downscaled product calibrated with European % grazed land in 1 km grid On decreased NDVI * % forest land cover in 1 km grid
CARBON BALANCE for year 2000 1 – GRID cells, 1km²
CARBON BALANCE for year 2000 2 – River basins
CARBON BALANCE for year 2000 3 – Administrative regions (NUTS)
THANK YOU VERY MUCH! Emil.Ivanov@nottingham.ac.uk