Download

1 / 8
80 likes | 158 Views
Explore the looming "Taxmageddon" in December with a $494 billion tax increase, federal government default risks, and insights on the political landscape in the U.S. congress and presidency. Get informed about the current makeup of the House, Senate, and critical battleground states. Delve into the budget comparison between Ryan and White House proposals.

E N D
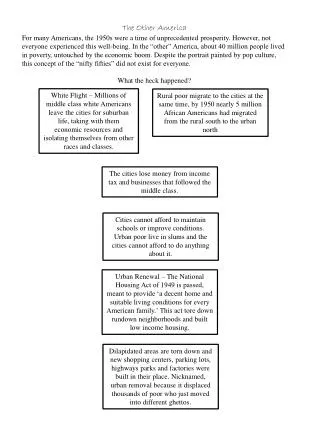
Arley Johnson Executive Director Advocates for The Other America ‘I hear Nixon’s a hell of a poker Political Outlook
Political Outlook • “Taxmageddon” looming in December • Taxpayers face $494 billion tax increase on 1/1/13 • Debt ceiling increase needed • FY13 gridlock • Future crisis of federal government facing default unless entitlements are reformed • “Doomsday” Commission ultimately becomes only way to resolve gridlock
Political Outlook • House of Representatives • Recent History: Democratic control for 40 years (1955-1995), Republican Revolution (1995-2007), then two waves (2006/2008, 54 seat change and 2010, 64 seat change). • Current Makeup: 242 Republicans, 190 Democrats, 3 vacancies (all D seats). 25 seat flip needed for Democrats to retake House. • Cook Political Report: 54 seats are Lean or Toss Up (22 D / 31 R). (as of 5/3/12)
Political Outlook • Senate • Current Makeup: 53 Democrats (including Independents); 47 Republicans. 4 seat flip (assuming Obama victory) needed for Republican takeover. • 33 Members in Cycle: 23 D / 10 R • 12 Open Seats: 7 D / 5 R (incl. Lugar primary loss) • Cook Political Report: 14 Seats are Lean or Toss Up (as of 5/3/12)
Political Outlook • Congress • Both parties will tell you they have a path to keep or retake power of both the House and Senate. • Effect of Redistricting? • 94 Freshmen House Members (85 R / 9 D) up for reelection. Many Senators – 2006’s “majority makers” – up for first reelection. • Congressional Approval Rating: 14.6% (RCP Average 5/1/12)
Presidential Battleground States Source: Real Clear Politics as of 5/14/2012
Comparing the Ryan to the White House budget • · 2 trillion dollars less in tax revenue • · Spend 5.3 Trillion dollars less than White House over next decade • · 16% less than W.H. on Income Security programs for poor (from food stamps to housing assistance to the earned income tax credit) • · 25% less on transportation • · 33% less on than “education, training, employment, social services” • · 14.6% less on natural resources and environment • Defense • · 7% less than White House • White House Budget: • http://www.whitehouse.gov/sites/default/files/omb/budget/fy2013/assets/32_1.pdf • Ryan Budget: • http://budget.house.gov/uploadedfiles/chairmans_mark_fy013.pdf