Download
1 / 39
390 likes | 541 Views
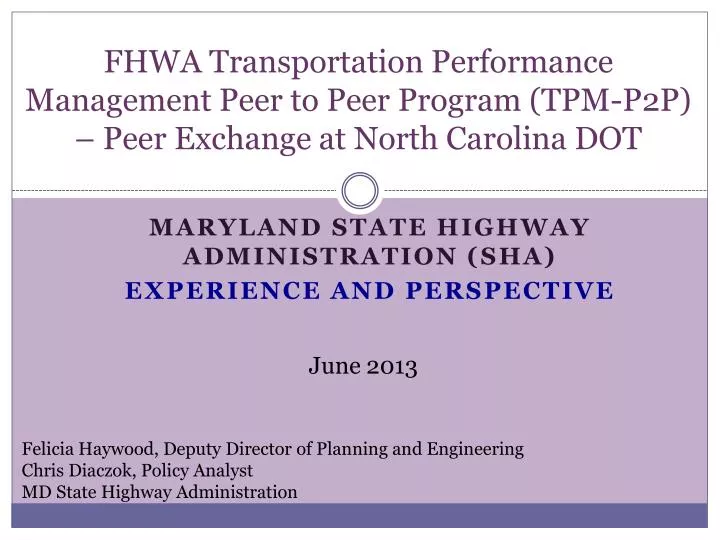
FHWA Transportation Performance Management Peer to Peer Program (TPM-P2P ) – Peer Exchange at North Carolina DOT. Maryland state highway administration ( sha ) experience and perspective. June 2013. Felicia Haywood, Deputy Director of Planning and Engineering

E N D
FHWA Transportation Performance Management Peer to Peer Program (TPM-P2P) – Peer Exchange at North Carolina DOT Maryland state highway administration (sha) experience and perspective June 2013 Felicia Haywood, Deputy Director of Planning and Engineering Chris Diaczok, Policy Analyst MD State Highway Administration
Presentation Outline • About Maryland and State Highway Admin. • Performance based processes at SHA • Data driven decision-making at SHA • Restructuring Planning Processes • Decision Support Tools and Applications • MAP-21 Ready
About Maryland US in microcosm with diverse geography – Appalachian ranges, Chesapeake Bay watershed and 3190miles of coastline Ranked 19th in Population, 5th in Density(5.8 million people, 2010) Baltimore-Washington region one of most congested in US
About MD Department of Transportation (MDOT) MDOT has direct supervision over all aspects of transportation in the State of Maryland. $3.6 billion annual budget funded through a common state Transportation Trust Fund. Funds two major urban transit systems, MTA in the Baltimore region and the WMATA in the Washington region. MTA served 415,000 riders/ weekday in 2011. Port of Baltimore is the fastest growing port in the US . One of the few deep water east coast ports to handle Large vessels (expected after Panama Canal Expansion) BWI Airport served more than 22.4 million passengers in 2011. Ranked6thin the nation for customer service and convenience by Travel & Leisure Magazine.
About MD State Highway Administration One of the six modals of the MDOT SHA system is the backbone of MD’s transportation system that provides mobility and access for people and goods. SHA operates, maintains and rebuilds the numbered, non-toll routes. SHA roads carry 65% of the state’s traffic and 85% of its truck freight. FY 11 Funding: $1.15 Billion
New State Funding • Federal Motor Fuel Tax – • Since 1993: $0.184 per gallon of gasoline • State Motor Fuel Tax – • 1993-2013: $0.235 per gallon of gasoline • 2013: • Indexes $0.235/gallon to CPI • 1% sales tax on gasoline • 2015 = sales tax raised to 2% • 2016 = sales tax raised to 3% • 2017 = sales tax raised to 4% • Could go up to 5% if internet sales tax does not pass
Current SHA Challenges and Opportunities • One of the most congested regions in the US • Financial and Environmental Constraints • Focus on System Preservation and Efficiency with sustainable practices • Need to maintain economic competitiveness in the region and citizens’ quality of life • Support Administration’s “Smart Green and Growing” efforts thru’ Plan Maryland and MD Transportation Plan • Build robustness in the system to handle shocks and uncertainty - natural, social, economic etc.
Performance Based Processes at SHA • Key Drivers for Performance based Approach • Evolution of Performance Measurement at SHA • Performance Management at SHA • SHA Business Plan (FY 2012-15 )
Key Drivers for Performance-Based Approach SHA Mission Statement Provide a safe, well-maintained, reliable highway system that enables mobility choices for all customers and supports Maryland’s communities, economy and environment. SHA Vision Provide a world-class highway system. Support MDOT and the Administration’s broader initiatives, policies and goals.
2000 Evolution of Performance Measurement at SHA • Managing for Results (MFR) Executive Order • First SHA business plan – goals and strategies 1996 • Year 2000 SHA Business Plan • Creation of 8 Key Performance Area Councils • Business Planning as Part of Performance Excellence (PE) • Focus on creating an outcome-centric business plan • Developed by senior leaders with staff support • Link to local office/district implementation plans • Performance audits by OLA 2002 • Managing for Results (MFR) Becomes State Law • New business plan every 4 years 2004 • StateStat • Incorporates output-based accountability into MFR 2006
Performance Management at SHA Performance-based approach to management based on Baldrige Criteria for Performance Excellence Statutory Regulatory Requirements • Managing for Results (MFR)/StateStat • MDOT Attainment Report • Government Performance and Results Act (GPRA) Ensures agency accountability with reliable data driven processes Target Setting and Outcome oriented approach
SHA Business Plan (FY 2012-15 ) KEY PERFORMANCE AREAS (KPA) Highway Safety Mobility/Economy System Preservation and Maintenance Managing our Agency Environmental Compliance and Stewardship Customer Communications, Service and Satisfaction Focus on OUTCOMES Objectives and Strategies are • Specific • Measurable • Achievable/Attainable • Results oriented • Time-bound Agency wide and office/ district level plans are aligned
Data Driven Decision-makingat SHA • SHA Decision-making Framework • Key Performance Based Planning Areas • Safety • Mobility/ Economy • System Preservation/ Asset Management
SHA Decision-making Framework WHAT/ WHEN/ WHERE? HOW? WHY? Outcome Goals/ Needs Projects/ Outputs Process/ Program Safe, well-maintained and reliable highway system for Maryland’s communities, economy and environment Spot/ Corridor Level Safety Improvements Major/Mid-Major CSIS/ CSIL RSA/ PRSA Safety Corridors SAFETY Annual Mobility Report MD Statewide Model Comp. Hwy. Corr. (CHC) Major/Minor Projects Signals, Bike/ Peds ATDM, Incident Mgmt. MOBILITY SYSTEM PRES. Transportation Asset Management Systems (Pavement, Bridges, Signals) Resurf, Bridge Repair/ Rehab., CC Adaptation, Signals, etc.. ENVIRONMENT Green Infrastructure Carbon Neutral Corr. SWM Facilities Reforestation TMDL Reductions
SHA Safety KPA • MD Strategic Highway Safety Plan (SHSP) • Zero Fatality Goal • Reduce fatalities and serious injuries in half by 2030 • 4-E approach to Safety • Engineering • Education • Emergency Medical Services (EMS) • Enforcement 6 Emphasis Areas
SHA Mobility/ Economy KPA Various objectives, performance measures and strategies to achieve SHA Mobility goals • Key Areas • Mobility and Reliability • Incident Management and Traveler Information Systems • Multimodalism/ Smart Growth • Freight • MD Annual State Highway Mobility Report summarizes • the annual state highway system performance • effects of SHA policy/ programs/ projects • identifies bottlenecks and needs to alleviate congestion and improve mobility and reliability http://www.roads.maryland.gov/OOTS/2012_Maryland_State_HIghway_Mobility_Report.pdf
SHA Asset Management - Structures One Maryland One Map Initiative http://maps.roads.maryland.gov/Sha_bridgeimap/
Asset Management- Conceptual Framework • Current Focus to develop • Transportation Asset Management Plan (TAMP) for • long term sustainability • accountability • performance • Data driven processes to encourage collaboration across funding categories • Risk-based analysis processes to tackle uncertainty • Develop outcome measures to track performance of asset classes and programs
Asset Management Process for Asset Managers Asset Matrix
Established Programs – Asset Data Warehouse • Spatial Data Inventory • Lighting Assets • Signs • Traffic Barriers • Rumble Strips • Line Striping • Weather sensors • Integrated data sources • Web-based editing • Reporting Oracle/SDE
MD Highway Vulnerability due to Sea Level Rise SHA maintains 8,124 miles of roadway and 2,578 structures • 103 miles of state highways in 100-year floodplain, 413 miles in 500-year floodplain • FEMA 100-Year Floodplain indicates 28% of SHA Structures need further impact evaluation
Restructuring the Planning Processes at SHA • Planning Process • Planning for Operations Projects • Scenario Planning and Analysis • Planning Performance Metrics
Restructuring the Planning Process 3 Broad Project Categories PLANNING FOR OPERATIONS PROJECTS CORRIDOR FEASIBILITY VISION STUDIES MAJOR CAPITAL PROJECTS Comprehensive Highway Corridors Corridor Feasibility Studies County/ Local Inputs Asset performance Goals Comp. Highway Corridor Screening Statewide Model Demand Projections Priority Safety Corridors MTP NEPA Studies SHA e-GIS HNI CTP ROW, Design, Construction HNI: Highway Needs Inventory, MTP: MD Transportation Plan CTP: Consolidated Transportation Program
Planning for Operations Projects • Collaboration and coordination efforts between planning, operations, and others to improve regional transportation system performance • Archived speed and traffic data to identify and prioritize projects • Low cost, short-term operational improvements in a strategic manner • Life-Cycle and Benefit/ Cost based evaluation • Focus on transportation system management and operations (TSM&O) • Before/ after studies to understand outcomes
Planning Performance Metrics Statewide, regional, jurisdictional, cluster, corridor, and zonal level • VMT • Vehicle Hours Travel and Delay • PersonsHour Travel and Delay • Congested Lane Miles • Accessibility (auto and transit) • Connectivity (auto and transit) • Internal vs. External Trips • Economic Indicators 27
Scenario Analysis Approach to Plan for Uncertainty Demand Highway Fuel Price Transit 39.5% 19.4% 4.3% -0.5% -5.6% 2030CLRP -8.1% -8.3% -15.9% BaseYear Base Year (2007) VMT = 143 million
Decision Support Tools and Applications CHC- MOSAIC Maryland Statewide Transportation Model UMD VPP Suite and RITIS Travel Modeling and Traffic Simulation Tools Enterprise GIS (e-GIS)
Comprehensive Highway Corridors- MOSAIC • Analyze strategic corridors in short and long term • To take a data driven approach to the Highway Needs Inventory. • Analyze different project improvement alternatives to expedite the project planning process. • Organize data layers and develop outputs to assist in corridor selection. Data Inputs Environmental Economic Mobility Safety Process MOSAIC HNI Outputs Project Planning Studies
Maryland Statewide Transportation Model (MSTM) • Multi-layer travel demand model working at national, statewide and regionallevelsto forecast and analyze key measures of transportationsystem performance. • Model Applications • System Performance and Long-Range Planning • Corridor Studies • Scenario Planning • Freight Movement National Statewide Local
Travel Modeling and Traffic Simulation Tools TRAVEL DEMAND MODELS (MSTM, MPO Models) PLANNING MESOSCOPIC MODELS PLANNING & OPERATIONS TRAFFIC SIMULATION MODELS OPERATIONS
SHA Enterprise GIS (e-GIS) Initiatives Building GIS technology based data architecture so that one system feeds all business purposes in and outside the agency Various levels of e-GIS Implementation Operational e-GIS: supports day-to-day business needs 2. Executive e-GIS: designed for leadership with certain functions and reporting capabilities 3. External Performance Measurement e-GIS: performance dashboard type displays and maps 4. External Tools e-GIS:an external operational user experience with paired down data 5. Mobile e-GIS: Could be the same as 3-4 Business Need Analysis Decision Support
Enterprise GIS Applications (e-GIS) • Common interface between multiple databases/ programs/ processes • Based on “One Maryland One Map” philosophy • Decision-support system • Capabilities Include • Route Search • Data Overlay • Data Query • Reporting Tools • Photo Viewer • Summary Charts • Feature Details
National Goals: • Safety • Infrastructure Condition • Congestion Reduction • System Reliability • Freight Movement and Economic Vitality • Environmental Sustainability • Reduced Project Delivery Times • National goals are considered in National Highway Performance Program, Metro planning, & Statewide planning. Source: http://www.fhwa.dot.gov/map21/docs/
MAP 21 Ready • Current SHA Business Plan performance measures could be used/ modified to meet MAP 21 requirements. • SHA is linking the MAP 21 measures and StateStat measures using spatial (GIS) and dashboard interfaces • SHA will work with MTA and other transit agencies to make sure that transit performance targets are achieved • Linking performance based systems to programming decisions • SHA will work continue work on the following: • Asset Management Plans • Strategic Highway Safety Plan • CMAQ Performance Plan • State Freight Plan
SHA and MPO Coordination • SHA and MDOT will coordinate with BMC, MWCOG and other MPOs to • select performance targets for consistency • integrate performance plans into the planning process Source: USDOT MAP 21 Presentation
THANK YOU !! contact INFORMATION Felicia Haywood – fhaywood@sha.state.md.us Chris Diaczok– cdiaczok@sha.state.md.us MD State Highway Administration