Download
1 / 7
70 likes | 149 Views
Learn about calculating natural tolerance limits and interpreting tolerance intervals for statistical analysis with known and unknown population mean and standard deviation. See how confidence levels impact uncertainty in analysis.

E N D
Lecture 14 Chapter 7 Tolerance Intervals
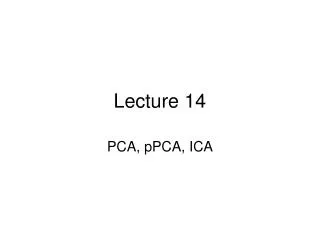
Last topic: Tolerance Intervals Gray Area = 0.99 Area = 0.005 Area = 0.005 LNTL0.99 UNTL0.99 Total area at two tails = 0.01 Total gray area = 0.99
When population and are known, the natural tolerance limits are calculated in a straight forward way.. • LNTL(1-) = z/2· • UNTL(1-) = + z/2·
Natural Tolerance Limits when and are not known: We will denote the tolerance level with (, 1), representing the level of confidence, which is less than 100% due to the uncertainty because of using sample average and variance.