Download
1 / 10
110 likes | 306 Views
Review Exercises. Pagano and Gauvreau (2 nd Edition) Chapter 2: Problems 2, 9, 10 and 14. Review Exercise 2.5. #2. How do ordinal data differ from nominal data?. The categories have an order.

E N D
Review Exercises Pagano and Gauvreau (2nd Edition) Chapter 2: Problems 2, 9, 10 and 14
Review Exercise 2.5. #2. How do ordinal data differ from nominal data? • The categories have an order.
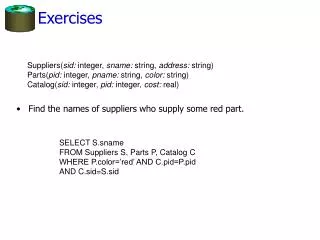
Review Exercise 2.5. #9. The table below categorized 10,614,000 office visits in the US by duration. STATEMENT: Office visits are most often between 16 and 30 minutes long. • Do you agree? (see Excel file: Chapter2-problems-pagano.xls
Review Exercise 2.5. #9.Evaluate Rate of visits Are office visits most often between 16 and 30 minutes long? • No- based on rates, 11-15 min has highest rate of visits. (see Excel)
Review Exercise 2.5. #10.Construct a Bar Chart (ejs10b540p03.sas) DATA d; INPUT Year cases; LABEL cases="Number of Cases"; CARDS; 1983 122 etc; RUN; PROCGCHART ; VBAR year / DISCRETE SUMVAR=cases; TITLE1 "Figures 1. Number of Pediatric AIDS cases reported in the US by Year"; FOOTNOTE1 "Source: &prg"; RUN;
Review Exercise 2.5. #14.Construct a Percent Freq Polygon (ejs10b540p04.sas) DATA d; INPUT endpoint midpoint yr1979 yr1987; LABEL endpoint="Blood Lead (ug/dl):ENDPOINT" midpoint="Blood Lead (ug/dl):MIDPOINT" yr1979="Percent"; CARDS; 20 10 11.5 37.8 etc ; RUN; SYMBOL INTERPOL=JOIN; PROCGPLOT; PLOT yr1979*midpoint yr1987*midpoint /OVERLAY ; TITLE1 "Figure 1. Initial Plot of Percent with Blood Lead for Canadian Workers by Year"; FOOTNOTE1 "Source: &prg"; RUN;
Review Exercise 2.5. #14. Construct a Percent Freq Polygon (ejs10b540p04.sas) DATA d1; INPUT endpoint midpoint yr1979 yr1987; CARDS; 0 0 0 0 20 10 11.5 37.8 etc 95 85 9.4 0.4 100 100 0 0 ; RUN; SYMBOL INTERPOL=JOIN; PROCGPLOT; PLOT yr1979*midpoint yr1987*midpoint /OVERLAY ; TITLE1 "Figure 2. Percent with Blood Lead for Canadian Workers by Year"; FOOTNOTE1 "Source: &prg"; RUN;
Review Exercise 2.5. #14. Construct a Percent Freq Polygon (ejs10b540p04.sas)Express as rates (per 10 years) DATA d2; SET d1; p1979=yr1979; p1987=yr1987; IF endpoint=20 THEN DO; p1979=yr1979/2; p1987=yr1987/2; END; RUN;
Review Exercise 2.5. #14. Construct a Percent Freq Polygon (ejs10b540p04.sas)Express as rates (per 10 years) DATA d2; SET d1; p1979=yr1979; p1987=yr1987; IF endpoint=20 THEN DO; p1979=yr1979/2; p1987=yr1987/2; END; RUN;
Review Exercise 2.5. #14. Construct a Cum Percent Distribution (ejs10b540p04.sas) *******************************************; *** Create cumulative percents ; *******************************************; DATA d2; SET d1; RETAIN cyr1979 cyr1987; IF _N_=1 THEN DO; cyr1979=0; cyr1987=0; END; cyr1979=cyr1979+yr1979; cyr1987=cyr1987+yr1987; LABEL cyr1979="Cum Percent 1979" cyr1987="Cum Percent 1987"; RUN; SYMBOL INTERPOL=JOIN; LEGEND1 label=none value=(h=2 font=swiss '1979' '1987') POSITION=(bottom right inside) mode=protect cborder=black; PROCGPLOT; PLOT cyr1979*endpoint cyr1987*endpoint /OVERLAY LEGEND=Legend1; TITLE1 "Figure 4. Cumulative Relative Frequency of Percent with Blood Lead for Canadian Workers by Year"; FOOTNOTE1 "Source: &prg"; RUN;