Download
1 / 19
190 likes | 337 Views
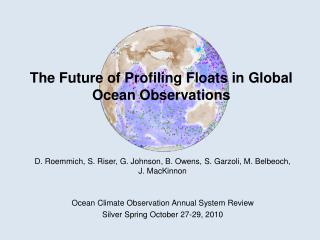
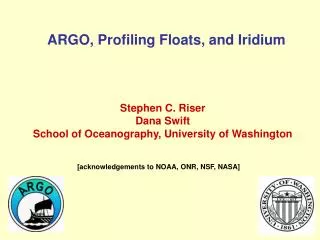
UNDERSTANDING OCEAN CHEMISTRY AND BIOLOGY USING REAL-TIME DATA FROM PROFILING FLOATS Kenneth Johnson, George Matsumoto Monterey Bay Aquarium Research Institute Carolyn Scheurle, Herve Claustre Laboratoire d'Océanographie de Villefranche Mary Jane Perry, University of Maine,

E N D
UNDERSTANDING OCEAN CHEMISTRY AND BIOLOGY USING REAL-TIME DATA FROM PROFILING FLOATS Kenneth Johnson, George Matsumoto Monterey Bay Aquarium Research Institute Carolyn Scheurle, Herve Claustre Laboratoired'Océanographie de Villefranche Mary Jane Perry, University of Maine, Stephen Riser, University of Washington
Feb. 16, 2012 Can real-time oceanographic data be used to increase the effectiveness of science education?
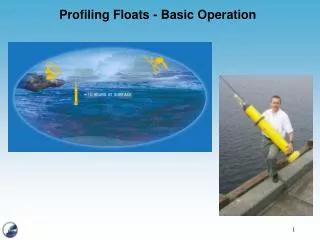
Profiling floats have a 4 to 5 year lifetime, make measurements from 1000 or 2000 m to the surface each 5 to 10 days. Data direct to Internet. 15 min. 5 to 10 days
Thousands of floats. Hundreds have biogeochemical sensors.
Biogeochemical sensors making beautiful records of ocean chemistry, biology & physics. How do we best create broader impacts? Float 5145 and 6972 at Ocean Station Papa
Make data easily accessible to students: www.mbari.org/chemsensor/floatviz.htm developed with NSF support (OCE 0825348)
Allinstruments (profilingfloats & gliders) operated by OAO canbefollowed and their data viewed in real-time via the website: www.oao.obs-vlfr.fr OceanographicAutonomousObservations:web interface
2. Use the float data as a window to the ocean to explore concepts developed in labs and lectures: OceanographicAutonomousObservations:concept « adopt a float » • Originally initialized by SEREAD (Scientific Educational Resources and Experience Associated with the Deployment of Argo profiling floats in the South Pacific Ocean), now enlarged to biogeochemistry: • School classes may follow a profiling float during its scientific journey • Possibility to analyze data with teachers (educational resources provided by the scientists) • The interactive map shall be adapted to fit to these specific needs • dedicated pages for the classes to participate and contribute (e.g. newsletters, films) • « Cross-adoption » may facilitate intercultural exchanges Iceland IrmincerSea
University of Maine, SMS 204, Integrative Marine Science II: Physics and Chemistry of Marine Systems (E. Boss, MJ Perry)7564 Arctic float in Greenland Sea
Students do laboratory experiments to understand phytoplankton growth and nutrient requirements.
The 7564 float data in August and September reinforce the laboratory experiments. The storm increases nitrate concentration in the euphotic zone.
I had students stand up and explain the various graphs. They are all primed to find out when the spring bloom happens.
The fall phytoplankton bloom in the Greenland Sea – Float 7564Arctic Zero nitrate, No fertilizer TEMPERATURE[°C] Low chlorophyll = Few phytoplankton CHLOROPHYLL[µG/L]
The fall phytoplankton bloom in the Greenland Sea – Float 7564Arctic Nitrate injected Storm mixes water column, bringing up cold, NO3- rich water TEMPERATURE[°C] CHLOROPHYLL[µG/L] Phytoplankton bloom forms
The fall phytoplankton bloom in the Greenland Sea – Float 7564Arctic Vigorous mixing cools water, injects more nitrate, dilutes chlorophyll faster than plankton can grow TEMPERATURE[°C] CHLOROPHYLL[µG/L]
The fall phytoplankton bloom in the Greenland Sea – Float 7564Arctic When does water start to warm? When does chlorophyll start increasing? When will nitrate start decreasing? Will we see deep convection? I check weekly!!! I’m hooked. Vigorous mixing cools water, injects more nitrate, dilutes chlorophyll faster than plankton can grow TEMPERATURE[°C] CHLOROPHYLL[µG/L]