Download
1 / 23
240 likes | 448 Views
A Tool for Economic Valuation of Ecosystem Services in Flanders. Sara Ochelen – Flemish Ministry of Environment, Nature and Energy. Outline. Introduction: what are Ecosystem Services and why economic valuation How economic valuation works Products available and planning

E N D
A Tool for Economic Valuation of Ecosystem Services in Flanders Sara Ochelen – Flemish Ministry of Environment, Nature and Energy
Outline • Introduction: what are Ecosystem Services and why economic valuation • How economic valuation works • Products available and planning • Results from a case study • Conclusions
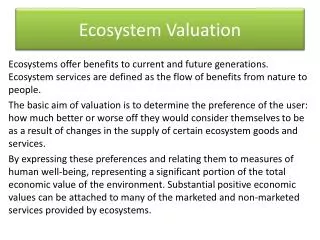
1.1 Ecosystem services Ecosystem services (ESS): “all the goodsand services that ecosystemsdeliverto society” • Nature and the ESS itdelivers are notfullyaccountedfor in decision making • Becausemany ESS are notknownuntilthey are lost: e.g. protectionagainstfloodings, regulation of the climate, pollination of cropsby wild insects… • Because the value of ESS is notvisible in prices.
1.2 Economic valuation Economicvalue of nature = contributionto welfare • Contributionto the utility of people, materialandimmaterial, • via theiruse of nature (e.g. recreation of clean air), but also via socalled non-use (psychologicalvalue). • Economische value ≠ financial value (cash flow yield). Whyeconomicvaluation • Trade-offspossibleif impacts expressed in the same unit: € => Benefits versus costs in decisionswithan impact on nature • Value of ESS more visible, awareness raising. • Paymentsfor ESS. • EU-biodiversitystrategy ; UN The Economics of EcosystemsandBiodiversity TEEB. http://vimeo.com/16961590
1.3 Better cost benefit analyses • CBA = decisionaid tool todescribeandquantifyallsocialcostsand benefits of projects or measures (≠ scenarios), in € takinginto account all welfare effects. • Correct CBA => • transparant trade-offs, betterinformeddecisions. • IF also the impacts on ESS are included! • Understand the full evaluationsequence, notonlyresult in € • Verydemandingtoundertake complete analysis from scratch.
1.4 Study and toolkit • Team of economists and ecologists: VITO, University of Antwerp, Free University of Amsterdam: “Economic valuation of ESS for SCBA”. • Toolkit: manual and webtool Nature Value Explorer. • A range of ESS valued and quantified, ≠ methods used. • Balance: easy to use vs. accuracy: • Too complicated methods will not be used • Too simple methods are not credible • Where possible: value function transfer methods: ready-to-use formula that need input of site specific values => applicable in many different cases and situations
2.1 Which Ecosystem Services studied? • Cultural services: • Value of recreation /Amenity value (use); • Value of existence and preserving nature for future generations (non-use). • Regulating services: • Denitrification • N, P & C-sequestration in soils; • N, P & C-sequestration in forest biomass; • Impact on air quality by capturing polluents like PM10; • Noise mitigation/buffer function by forests. • Lacuna: • Several reg. services like water retention • Production services
2.2 Value of cultural services • No prices economic valuation techniques. • Expensive and time consuming. • We want ready-to-use formula for many cases. • Valuation function developed with empirical data. • Reveal value of people by asking them questions. • Choice experiment: sophisticated questionnaire: multiple pretests, representative sample, rigourous statistical analysis of results… • Interviewed 3000 people in Flanders with choice cards.
2.4 Valuation function cultural ESS • All answers pooled: empirical information about preferences for nature valuation function: • Forest > heath land > grassland. • Available trails > no trails. • Members NGO > non members. • Close to home > far away. WTP/hh/yr = a * pioneer vegetation + b * mudflats and marshes + c * natural grasslands + d * forests + e * open water, reed or swamps + f * heathland or land dunes + g * size in ha + h * biodiversity (no of species) – i * age if high biodiversity + j * availability of walking- and biking trails – k * distance in km + l * natural adjacent area + m * adjacent residential area – n * adjacent industrial area + o * income – p * % women + q * % membership
Value of regulating services Change in quantity x price Δ ton CO2 in soil Δ kg PM in air Δ decibel in houses Δ kg N in water … 50 €/ton CO2 (international literature) 30 €/kg PM (health costs) 1% house value/dB (house depreciation) 74 €/kg N (marginal abatement cost) …
2.7 Avoided cost method nutrients • Based on costeffectiveness analysis to set up riverbasin management plan for Water Framework Directive: 74€/kg N Broekx et al., 2011. Cools et al., 2011.
3.1 Available: Manual • Launched 1 yearago. • Updates in upcomingyears • Provedtobe a high workloadtoapply. • Room forinterpretationcan lead tomistakes. (ngo: 100 ha forestnearAntwerp is 1 billion €) • Webtool Natuurwaardeverkenner: Nature Value Explorer • The manual can be consulted on: http://www.lne.be/themas/beleid/milieueconomie/waardering-van-baten-en-schaden/literatuur-over-economische-waardering. • Short summary in English
3.3 Planning: next steps IT: • Reporting: more transparency in calculationsanduncertaintymargins • Sharingresults-discussions • Periodicestimatesinsteadof single year Methodologicaldevelopments: • Include more services: production, pollination… • Locationspecificchoice experiments tovalidateresults more abstract experiment • Use of recreation data foramenityvalues April 2012: version 1.1 Spring 2013: version 2.0
4.1 case Hoegaardse Vallei Value of 210 ha nature in the valley of Hoegaarden = ? Meldert Hoegaarden
4.2 ESS which could be computed • Amenityandexistencevalue • Denitrification • C-N-P sequestration in soils • C-N-P sequestration in forestbiomass • Air quality (particulate matter) • Noisemitigation: notapplicable Couldnotbecomputed, but nevertheless important: • Water retention: protectionagainstfloods • Erosion control • Pollination • Green corridors • High biodiversity as such
4.5 Results from the tool Culturele waarde Totaal ∑ Reg. Diensten (N óf P)
4.6 Value ESS Hoegaarden Valley Area • Culturalvalue: 850.000 families: 8,6 million €/y • Removalnutrientsfrom water system: 4,6 million €/y • Denitrification • N and P- sequestration • Climateregulation: 800 ton carbon 0,15 million €/y • Air quality: 1800 kg PM 0,05 million €/y Total valuecomputed ESD 13 à 14 million €/y or 65.000 euro/hectare/year Attention: make the baseline explicit: whichsituation are we comparingwith: hereassumptionagricultural area (fieldsandmeadows)!
Conclusions • Tool available for Flanders to quantify multiple ecosystem benefits and to express them in money terms. • Enables summing up and comparing value new nature or destroyed nature with other benefits and costs in CBA. • Tool supplied to potential users (administrations, consultancies, ngo’s) on voluntary basis, spread by media, presentations and courses. • Remaining challenges concerning quantification and data availability and quality, users of tool involved in the follow-up study and further development (crowd coding). • Step forward for better informed decisions on measures and projects with impacts on ecosystems.
Thank you for your attention! for more information, please contact Tanya.Cerulus@lne.vlaanderen.be http://milieueconomie.lne.be