Download
1 / 41
410 likes | 519 Views
HOW PETASCALE VISUALIZATION WILL CHANGE THE RULES. 10/12/09. Hank Childs Lawrence Berkeley Lab & UC Davis. Supercomputing 101. Why simulation? Simulations are sometimes more cost effective than experiments. New model for science has three legs: theory, experiment, and simulation.

E N D
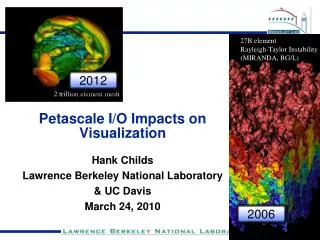
HOW PETASCALE VISUALIZATION WILL CHANGE THE RULES 10/12/09 Hank Childs Lawrence Berkeley Lab & UC Davis
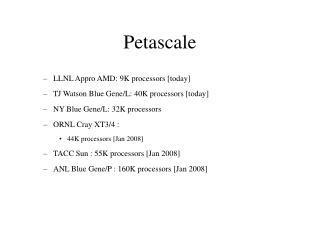
Supercomputing 101 • Why simulation? • Simulations are sometimes more cost effective than experiments. • New model for science has three legs: theory, experiment, and simulation. • What is the “petascale”? • 1 FLOP = 1 FLoating point OPeration per second • 1 GigaFLOP = 1 billion FLOPs, 1 TeraFLOP = 1000 GigaFLOPs • 1 PetaFLOP = 1,000,000 GigaFLOPs • PetaFLOPs + petabytes on disk + petabytes of memory petascale • Why petascale? • More compute cycles, more memory, etc, lead for faster and/or more accurate simulations.
Petascale computing is here. • 4 existing petascale machines Julich JUGene UTK Kraken ORNL Jaguar LANL RoadRunner
Supercomputing is not slowing down. • Two ~20 PetaFLOP machines will be online in 2011 • Q: When does it stop? • A: Exascale is being actively discussed right now • http://www.exascale.org LLNL Sequoia NCSA BlueWaters
How does the petascale affect visualization? Large scale Large # of variables Large ensembles Large # of time steps
Why is petascale visualization going to change the rules? • Michael Strayer (U.S. DoE Office of Science): “petascale is not business as usual” • Especially true for visualization and analysis! • Large scale data creates two incredible challenges: scale and complexity • Scale is not “business as usual” • Supercomputing landscape is changing • Solution: we will need “smart” techniques in production environments • More resolution leads to more and more complexity • Will the “business as usual” techniques still suffice? Outline • What are the software engineering ramifications?
P2 P4 P1 P3 P0 P5 P8 P7 P6 P9 Production visualization tools use “pure parallelism” to process data. Parallelized visualization data flow network Parallel Simulation Code Read Process Render Processor 0 Read Process Render P0 P1 P2 P3 Processor 1 P4 P5 P6 P7 Read Process Render Pieces of data (on disk) P8 P9 Processor 2
Pure parallelism: pros and cons • Pros: • Easy to implement • Cons: • Requires large amount of primary memory • Requires large I/O capabilities • requires big machines
“Petascale machine” Terascale machine Pure parallelism performance is based on # bytes to process and I/O rates. • Vis is almost always >50% I/O and sometimes 98% I/O • Amount of data to visualize is typically O(total mem) • Relative I/O (ratio of total memory and I/O) is key Memory I/O FLOPs
Time to write memory to disk Anedoctal evidence: relative I/O is getting slower.
Why is relative I/O getting slower? • “I/O doesn’t pay the bills” • Simulation codes aren’t affected.
1TZ 16K, 32K Dawn Franklin Cray XT4 #cores Problem Size Type Machine 8K 0.5TZ AIX 16K 1TZ Purple Ranger BG/P 4TZ 64K Sun Linux Cray XT5 2TZ JaguarPF Juno Linux 1TZ, 2TZ 16K 32K Recent runs of trillion cell data sets provide further evidence that I/O dominates • Weak scaling study: ~62.5M cells/core 2T cells, 32K procs on Jaguar • Approx I/O time: 2-5 minutes • Approx processing time: 10 seconds 2T cells, 32K procs on Franklin 12
Assumptions stated • I/O is a dominant term in visualization performance • Supercomputing centers are procuring “imbalanced” petascale machines • Trend is towards massively multi-core, with lots of shared memory within a node • I/O goes to a node • more cores less I/O bandwidth per core • And: Overall I/O bandwidth is also deficient
Pure parallelism is not well suited for the petascale. • Emerging problem: • Pure parallelism emphasizes I/O and memory • And: pure parallelism is the dominant processing paradigm for production visualization software. • Solution? … there are “smart techniques” that de-emphasize memory and I/O. • Data subsetting • Multi-resolution • Out of core • In situ
P2 P4 P1 P3 P0 P5 P8 P7 P6 P9 Data subsetting eliminates pieces that don’t contribute to the final picture. Parallelized visualization data flow network Parallel Simulation Code Read Process Render Processor 0 Read Process Render P0 P1 P2 P3 Processor 1 P4 P5 P6 P7 Read Process Render Pieces of data (on disk) P8 P9 Processor 2
Data Subsetting: pros and cons • Pros: • Less data to process (less I/O, less memory) • Cons: • Extent of optimization is data dependent • Only applicable to some algorithms
P2 P4 P1 P3 P0 P5 P8 P7 P6 P9 Multi-resolution techniques use coarse representations then refine. Parallelized visualization data flow network Parallel Simulation Code Read Process Render P2 Processor 0 Read Process Render P4 P0 P1 P2 P3 Processor 1 P4 P5 P6 P7 Read Process Render Pieces of data (on disk) P8 P9 Processor 2
Multi-resolution: pros and cons • Pros • Avoid I/O & memory requirements • Cons • Is it meaningful to process simplified version of the data?
P2 P4 P1 P3 P0 P5 P8 P7 P6 P9 Out-of-core iterates pieces of data through the pipeline one at a time. Parallelized visualization data flow network Parallel Simulation Code Read Process Render Processor 0 Read Process Render P0 P1 P2 P3 Processor 1 P4 P5 P6 P7 Read Process Render Pieces of data (on disk) P8 P9 Processor 2
Out-of-core: pros and cons • Pros: • Lower requirement for primary memory • Doesn’t require big machines • Cons: • Still paying large I/O costs • (Slow!)
P2 P4 P1 P3 P0 P5 P8 P7 P6 P9 In situ processing does visualization as part of the simulation. Parallel Simulation Code Read Process Render Processor 0 Read Process Render P0 P1 P2 P3 Processor 1 P4 P5 P6 P7 Read Process Render Pieces of data (on disk) P8 P9 Processor 2
P2 P4 P1 P3 P0 P5 P8 P7 P6 P9 In situ processing does visualization as part of the simulation. Parallelized visualization data flow network Parallel Simulation Code GetAccess ToData Process Render Processor 0 GetAccess ToData Process Render Processor 1 GetAccess ToData Process Render Processor 2 … … … … GetAccess ToData Process Render Processor 9
In situ: pros and cons • Pros: • No I/O! • Lots of compute power available • Cons: • Very memory constrained • Many operations not possible • Once the simulation has advanced, you cannot go back and analyze it • User must know what to look a priori • Expensive resource to hold hostage!
Summary of Techniques and Strategies • Pure parallelism can be used for anything, but it takes a lot of resources • Smart techniques can only be used situationally • Petascale strategy 1: • Stick with pure parallelism and live with high machine costs & I/O wait times • Other petascale strategies? • Assumption: • We can’t afford massive dedicated clusters for visualization • We can fall back on the super computer, but only rarely
Now we know the tools … what problem are we trying to solve? • Three primary use cases: • Exploration • Confirmation • Communication Examples: Scientific discovery Debugging Examples: Data analysis Images / movies Comparison Examples: Data analysis Images / movies
Exploration Notional decision process Confirmation No Interactivity required? Do algorithms require all data in memory? No Yes Communication No No In Situ (data analysis & images / movies) Out-of-core (Data analysis & images / movies) Do operations require all the data? Need all data at full resolution? Do you know what you want do a priori? Data subsetting (comparison & data analysis) Multi-resolution (debugging & scientific discovery) No Yes Yes Yes Yes Pure parallelism (Anything & esp. comparison)
Alternate strategy: smart techniques Multi-res Data subsetting In situ Do remaining ~5% on SC Out-of-core All visualization and analysis work
How Petascale Changes the Rules • We can’t use pure parallelism alone any more • We will need algorithms to work in multiple processing paradigms • Incredible research problem… • … but also an incredible software engineering problem.
File Reader (Source) Slice Filter Contour Filter Renderer (Sink) … a love story Data flow networks • Work is performed by a pipeline • A pipeline consists of data objects and components (sources, filters, and sinks) • Pipeline execution begins with a “pull”, which starts Update phase • Data flows from component to component during the Execute phase Execute Update
Data flow networks: strengths Source • Flexible usage • Networks can be multi-input / multi-output • Interoperability of modules • Embarrassingly parallel algorithms handled by base infrastructure • Easy to extend • New derived types of filters Filter A Filter B Filter C Sink Flow of data Inheritance Abstract filter Slice filter ???? filter Contour filter
Data flow networks: weaknesses • Execution of modules happens in stages • Algorithms are executed at one time • Cache inefficient • Memory footprint concerns • Some implementations fix the data model
Data flow networks: observations • Majority of code investment is in algorithms (derived types of filters), not in base classes (which manage data flow). • Source code for managing flow of data is small and in one place Algorithms don’t care about data processing paradigm … they only care about operating on inputs and outputs.
Example filter: contouring Contour filter Contour algorithm { Mesh input Surface/line output Data Reader Contour Filter Rendering
Example filter: contouring with data subsetting Communicate with executive to discard pieces Contour filter Contour algorithm { Mesh input Surface/line output Data Reader Contour Filter Rendering
Example filter: contouring with out-of-core Algorithm called 12 times 1 1 2 2 3 3 Contour filter 4 4 5 5 6 6 Contour algorithm 7 7 8 8 9 9 10 10 11 11 12 12 { Mesh input Surface/line output Data Reader Contour Filter Rendering
Example filter: contouring with multi-resolution techniques Contour filter Contour algorithm { Mesh input Surface/line output Data Reader Contour Filter Rendering
Example filter: contouring with in situ For each example, the contour algorithm didn’t change, just its context. Contour filter Contour algorithm { Mesh input Surface/line output X Simulation code Data Reader Contour Filter Rendering
How big is this job? • Many algorithms are basically “processing paradigm” indifferent • What percentage of a vis code is algorithms? • What percentage is devoted to the “processing paradigm”? • Other? We can gain insight by looking at the breakdown in a real world example (VisIt).
VisIt is a richly featured, turnkey application for large data. 27B element Rayleigh-Taylor Instability (MIRANDA, BG/L) • Tool has two focal points: big data & providing a product for end users. • VisIt is an open source, end user visualization and analysis tool for simulated and experimental data • >100K downloads on web • R&D 100 award in 2005 • Used “heavily to exclusively” on 8 of world’s top 12 supercomputers • Pure parallelism + out-of-core + data subsetting + in situ
VisIt architecture & lines of code Client side Server side • + custom interfaces • + documentation • + regression testing • + user knowledge • + Wiki • + mailing list archives 154K 10K gui viewer mdserver engine (parallel and serial) 29K libsim 14K 70K cli 103K 34K 55K 33K 192K 43K Plots Operators Plots Operators Databases 178K 32K / 559K Support libraries & tools Handling large data, parallel algorithms Pure parallelism is the simplest paradigm. “Replacement” code may be significantly larger.
Summary • Petascale machines are not well suited for pure parallelism, because of its high I/O and memory costs. • This will force production visualization software to utilize more processing paradigms. • The majority of existing investments can be preserved. • This is thanks in large part to the elegant design of data flow networks. • Hank Childs, hchilds@lbl.gov • … and questions???