Download

1 / 37
370 likes | 401 Views
This study explores the concept of "Capability" in Chinese and Indian manufacturing sources, focusing on productivity, quality, trade, and decision-making processes related to capability building. It delves into the implications of capabilities on market competition and firm sales equilibrium. The research highlights two polar patterns of escalation and proliferation in submarkets, emphasizing the importance of effectiveness in capability building for industries like flowmeters, aircraft, and machine tools. Furthermore, it examines the impact of globalization on capability transfer, growth, and investment phases, underlining the essential role of capabilities in driving global trade. The study presents evidence on FDI spillovers and industry-specific influences on capability development, with a focus on sectors such as auto components, domestic appliances, and machine tools. It also discusses changing market structures, market share volatility, and leadership transitions in Chinese industries. The study concludes with case studies on the auto component and machine tools industries, showcasing global integration, incentive alignment, and capability codification in the manufacturing sector of China and India.

E N D
The Globalization Process: Advancing Capabilities in Chinese and Indian Manufacturing
Sources • Sutton, Quality,Trade and the ‘Moving Window’, Economic Journal , Nov 2007 • Brandt, Rawski, Sutton, China’s Industrial Development, in press • Sutton, The auto-component industry in China and India: A Benchmarking Study
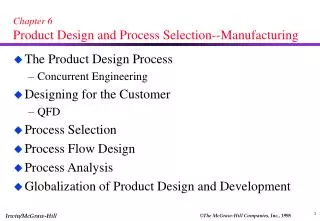
The “Capability” Concept • At one level, this is a straightforward generalisation of the standard concept of productivity.
The “Capability” Concept • At a deeper level it involves (a) relating the capability of the firm to the know-how of individual workers. (b) Analysing the decision of the firm to invest in capability building …… what is of central interest here is that this decision takes place in a climate of true (Knightian) uncertainty.
Capabilities d u c = ‘productivity’ u = ‘quality’ c d Capability is a pair (c, u) for each technical trajectory (submarket)
u (Quality) x x u/c = a x u/c = b 1/c (Productivity) Competing in Capabilities
Key feature: The consumers choose products offering the best u/p Implication: if u>v, the market share of a firm offering u cannot be eroded to zero by any number of firms offering v
Proposition 1 - given any configuration of capabilities (c1,u1), (c2,u2) . . (cn,un) there is a lower bound in (c,u) space below which a firm cannot achieve positive sales at equilibrium (ex. Cournot equilibrium)
Proposition 2 Suppose one element in building capability is the expenditure of fixed outlays (“sunk costs”) - Then competition in ‘capability building’ will lead to a bound on the number of firms ‘in the window’.
Two Polar Patterns ESCALATION PROLIFERATION Flowmeters Aircraft
σ Linkages Across Submarkets Large Commercial Jets β Effectiveness of Capability Building Flowmeters Numerical controls Machine Tools Cement
σ Linkages Across Submarkets β Effectiveness of Capability Building High Concentration Narrow Window High R&D intensity Low Concentration Wide Window High R&D intensity Low concentration Wide Window Low R&D intensity
Capabilities and Trade • Key Point: Breakdown of equivalence between productivity and quality • (Sutton EJ 2007) • Idea: once a tradeable input (Component, Raw material, etc.) is used, it sets a lower bound to price, so low wages can offset low productivity, but not low quality
The Globalization Process • Phase I: Impact phase…Capabilities given • Phase II: Transfer phase • Phase III: Re-investment (escalation) phase
Main substantive argument • The case for globalisation should rest primarily on the transfer and growth of capabilities it induces • A fundamental set of mechanisms are driven by the coexistence of high capabilities and low wages • These mechanisms include, inter alia, • ---self help driven by new incentives • ---Transfers via FDI/ Supply chains, etc.
Going it Alone • The Bharat Forge story • Increasingly difficult as we move across industrial spectrum
The Speed of Transfer • Delicately dependent on industry characteristics • Key channels differ by industry (a) Buyer search channel: Textiles (b) Trade Fairs: Ubiquitous (c) Supply chains: Vertical Transfers The Evidence on “FDI Spillovers”
Speed of Transmission FAST Auto components: Vertical relations with shared technology; standardization and codification of working practices. Domestic Appliances: Horizontal JVs – here incentives of senior partner are critical (cf. China). Machine Tools: Licencing;Public sector bodies . SLOW
Industry Specific influences • Textiles and apparel..Contact with Buyers(Ever Glory) • Steel: Equipment Suppliers(Shougang)
Changing Market Structures • Escalation and Shakeout : Chinese White Goods ; Beer • Market Share Volatility • Changing Leadership : Chinese TVs
A Tale of Two Industries :I Auto Components • …Globally integrated • … Capabilities codified • ...Supply Chain aligns incentives
Car Production 800,000 700,000 600,000 500,000 India million/yr 400,000 China 300,000 200,000 100,000 0 93 94 95 96 97 98 99 00 01 Note: Indian figures for fiscal year ’93-’94 are shown here as ’93, etc. Figure 16. Car Production in India and China 1993-2001
A Timescale for Capability Building • A multinational seat maker on a greenfield site in India drops from initial 2,085 ppm to 65 ppm in year 3. • A domestic Indian seat maker drops from 20,000 ppm to 200 ppm over 5 years. • Greenfield vs. Joint Venture
II : Machine Tools • Globally Fragmented • Supply Chain plays no role • Bilateral licencing deals • Some successful collaborations • Huge loss of position by Indian leaders • Chinese experience mixed
The Invidious Trade-Off controls ball-screws 55% wages Bought-in Components 15% 15% 15% Materials, Energy costs, etc. A typical cost breakdown
3-axis, 15 kW Japan size & complexity 11 kW, 350mm India Taiwan 7.5 kW, 165mm 0.25 1 4 Gross Labour Productivity
Japan 5 10 15 20 Taiwan India* 10 100 1000 Japan Taiwan India* Design staff (% of employees) Design staff (no. of employees) Figure 3. The size of design teams as a proportion of total firm employment (Panel a) and in terms of the number of employees (Panel b). *For India the HMT company is excluded from this comparison.
25 20 15 10 5 0 -1 3 -3 -2 0 1 2 Figure 5. Difference in general satisfaction with machine (1-5 rating) (Indian-Foreign). In this and subsequent figures, outcomes favourable to the Indian Machine are shown in green, and those favourable to the foreign machine re shown in red.
30 25 20 15 10 5 0 4 2 0 6 8 10 -8 >-8 -6 -4 -2 <10 Figure 7. Difference in % lost hours due to breakdown/no of machine hours booked. (Indian-Foreign)
ACE Designers • Small new entrant • Understands importance of quality/ price nexus • Focus on building capability in one core product
China in Machine Tools • Now exporting basic CNC machines • Serious challenges to capability building
OECD Perspectives • The Bernard – Schott Evidence • Survival and Flexibility • The European Debate and ‘Social Europe’ • Unfortunate Confusions