Download
1 / 63
630 likes | 679 Views
Learn how phosphorus affects water quality, its behavior in soil, challenges with manures, and using the Phosphorus Index. Explore accelerated eutrophication, impacts of phosphorus on lakes, and effective management strategies. Discover the implications for agriculture and sustainable practices.

E N D
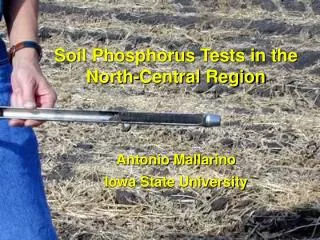
Soil Phosphorus Issues Miguel Cabrera and David Radcliffe Crop and Soil Sciences University of Georgia
Intended Outcomes • Understand how P affects water quality • Understand how P behaves in soil • Understand why manures present a special problem with P • Understand how to use the Phosphorus Index
How P Affects Water Quality • High levels of nutrients cause accelerated eutrophication (algal blooms) • P controls eutrophication in fresh water • Lakes are more sensitive than streams • Eutrophication can increase: • aquatic weeds • algal growth • low oxygen levels, • fish kills, • bad-tasting water (geosmin)
Accelerated by land use Natural Process DECADES CENTURIES
Lake in Canada Divided by plastic curtain For 8 years Nitrogen added each year to one side Nitrogen and phosphorus added to other side Every year there was an algal bloom in response to adding phosphorus www.umanitoba.ca/institutes/fisheries/eutro.html Accelerated Eutrophication
How P Affects Water Quality • High levels of nutrients cause accelerated eutrophication • P controls eutrophication in fresh water • Lakes are more sensitive than streams • Eutrophication can increase: • aquatic weeds • algal growth • low oxygen levels, • fish kills, • bad-tasting water (geosmin)
How P Affects Water Quality Summer 2007
Georgia Lakes with P TMDLs • Lake Lanier (2006) • Lake Allatoona (2006) • Carters Lake (2006) • Lake Walter F George (2006)
Intended Outcomes • Understand how P affects water quality • Understand how P behaves in soil • Understand why manures present a special problem with P • Understand how to use the Phosphorus Index
Root hair P P P P P P P P P P P P P P P P P P P P P P P Fe, Al P P P P P hydrous P P P P P P P oxides P P P P P P P P P P P P P P Time after P application How P Behaves in Soil
How P Behaves in Soil Soil test P (ppm) 50 100 150 200 0 0 10 Soil depth (inches) 20 No manure 40 lb P/acre/yr 90 lb P/acre/yr 110 lb P/acre/yr 30 40
How P Behaves in Soil Surface runoff 220 Dissolved P in surface runoff (ppm) 175 Mehlich-3 soil P (ppm)
Intended Outcomes • Understand how P affects water quality • Understand how P behaves in soil • Understand why manures present a special problem with P • Understand how to use the Phosphorus Index
Why Manures Present a Problem • Soil P levels high enough to cause runoff P concentrations > 1 ppm unlikely with fertilizer • Cost discourages over-application of P • Over-application of P occurs with manures • N-to-P ratio in manures is not the same as what crops need
Why Manures Present a Problem • Most crops need about 8 lbs available N for every lb of P • N:P ratio of 8:1 • In typical broiler litter there are about 35 lb of available N and 30 lb of P per ton of litter • N:P = 1.2:1 • For every 8 lb of N, litter supplies 6.7 lb of P • 6.7 times as much P as crop needs
Grain P Manure P Manure P P Rock Cycling of P: After World War II
Regional Imbalance of P • Typical poultry ration contains 60% corn • Less than 10% of the corn used in Georgia poultry feed is produced in the state • Georgia imports 135 million bushels of corn per year • Nearly 8,000 tons P imported each year
Long-term Solution: Close the Loop • One way to restore the P cycle would be to feed more locally-grown grain • Return manure to these fields • Expand acreage for manure application • Corn acreages could be expanded • But corn has problems with drought-tolerance, aflatoxin, and pests
Long-term Solution: Close the Loop New pearl millet hybrid may be a promising feed grain
Long-term Solution: Close the Loop • New pearl millet hybrid is called “Tifgrain 102” • Can be used as a substitute for corn grain in poultry, cattle, swine, and dairy rations • Check with county agent about local markets • http://pubs.caes.uga.edu/caespubs/pubcd/B1216.htm
Short-term Solution: BMP’s • Alter feed ration to reduce P in manure • Add alum to waste water • Don’t apply manure when runoff is likely • Incorporate or inject manures • Avoid artificially drained fields • Grass filters and stream-side buffers • Use practices that reduce runoff and erosion
Objectives • Understand how P affects water quality • Understand how P behaves in soil • Understand why manures present a special problem with P • Understand how to use the Phosphorus Index
Soluble P Particulate P Soluble P
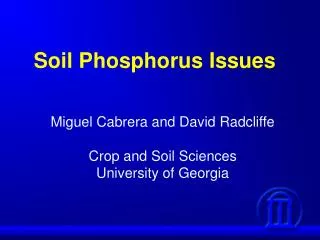
Soluble Phosphorus in Surface Runoff Overall Structure + Particulate Phosphorus in Surface Runoff + Soluble Phosphorus in Leachate Phosphorus Index
Soluble Phosphorus in Surface Runoff STP Org. P Inorg. P DRP
Soluble Phosphorus in Surface Runoff Soil Test P mg P/L Organic P mg P/L Inorganic P mg P/L X Runoff (L) + +
Soluble Phosphorus in Surface Runoff Soil Test P mg P/L Organic P mg P/L Inorganic P mg P/L X Runoff + + X Buffer Effect
Effect of Buffer Width If STP < 450 BF = e(-0.042 Width) If STP > 450 BF = 1
Soluble Phosphorus in Surface Runoff Overall Structure + Particulate Phosphorus in Surface Runoff + Soluble Phosphorus in Leachate Phosphorus Index
Particulate Phosphorus in Surface Runoff Sediment Loss (RUSLE) (tons/ac/yr) Bioavailable P in sediment (mg/kg) x
Particulate Phosphorus in Surface Runoff Sediment Loss (RUSLE) (tons/ac/yr) Bioavailable P in sediment (mg/kg) x X Buffer Effect
Soluble Phosphorus in Surface Runoff Overall Structure + Particulate Phosphorus in Surface Runoff + Soluble Phosphorus in Leachate Phosphorus Index
Soluble Phosphorus in Leachate STP Org. P Inorg. P DRP DRP DRP
Soil Test P mg P/L Organic P mg P/L Soluble Phosphorus in Leachate Inorganic P mg P/L X Leachate Volume + +
Estimation of Leachate Volume Leachate Vol (mm) = (P - 0.4s)2/(P + 0.6s) x 25.4 P = Annual precipitation = 50 inches s = (1000/CN) – 10 CN = curve number for percolation Williams and Kissel (1991)
Volume of Yearly Leachate 1250 mm rain
Soil Test P mg P/L Organic P mg P/L Soluble Phosphorus in Leachate Inorganic P mg P/L XLeachate Volume + + Depth to Water Table Factor
Soluble Phosphorus in Surface Runoff Overall Structure + Particulate Phosphorus in Surface Runoff + Soluble Phosphorus in Leachate Phosphorus Index
How to Use the P-Index • Use P Index (Excel spreadsheet) • P index = Risk of soluble P in runoff + Risk of particulate P in runoff + Risk of soluble P in leachate
Phosphorus Index Inputs • Phosphorus Sources • Phosphorus Transport • Best Mgmt. Practices (BMP’s)