Download
1 / 50
500 likes | 900 Views
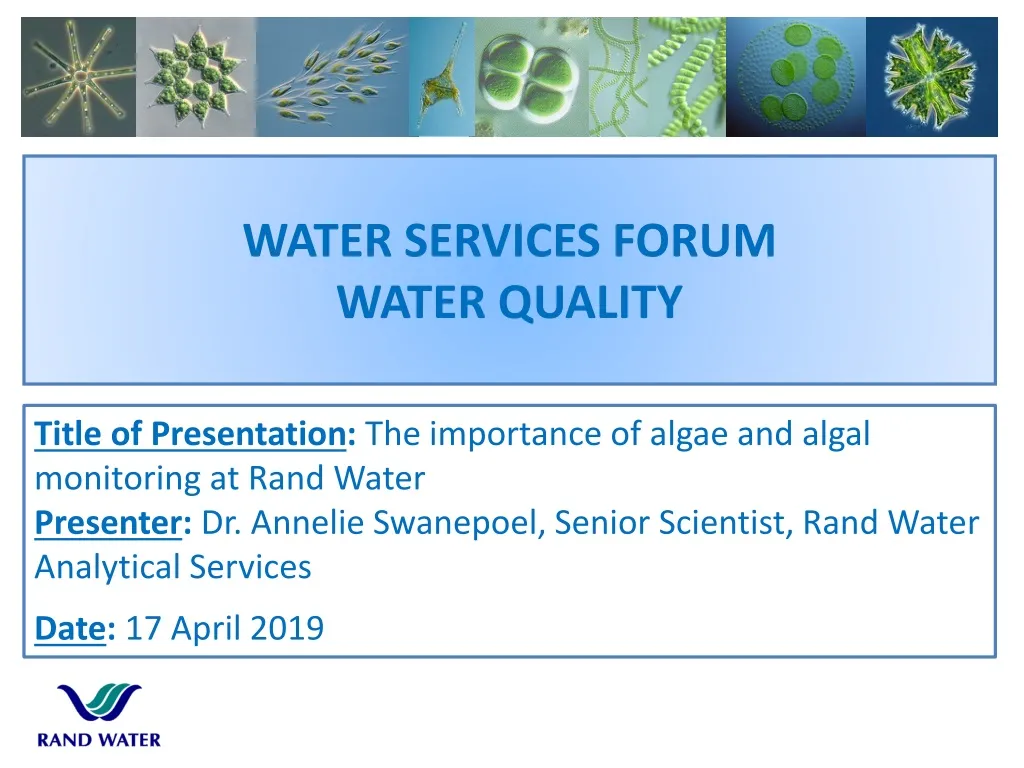
WATER SERVICES FORUM WATER QUALITY. Title of Presentation : The importance of algae and algal monitoring at Rand Water Presenter : Dr. Annelie Swanepoel, Senior Scientist, Rand Water Analytical Services Date : 17 April 2019. Presentation overview.

E N D
WATER SERVICES FORUMWATER QUALITY Title of Presentation: The importance of algae and algal monitoring at Rand Water Presenter: Dr. Annelie Swanepoel, Senior Scientist, Rand Water Analytical Services Date: 17 April 2019
Presentation overview • What are “algae” and “cyanobacteria” (is there a difference?) • Where can we expect to find algae? Human impact? • Why is the presence of algae (including cyanobacteria) such a challenge in drinking water production? • What risks are associated with algae/cyanobacteria? • How does Rand Water and other drinking water treatment facilities monitor and treat algae and cyanobacteria? • (2 case studies : Rand Water and Magalies Water) • How does algae research help Rand Water? • Concluding remarks
6CO2 + 6H2O C6H12O6 + 6O2 >70% of the earth’s OXYGEN
Algae vs. cyanobacteria Toxic, taste and odours
Introduction Indicator of water quality (very site specific) NCIS CSI CSI Bones
Human impact - eutrophication Cyanobacteria NO3 + PO4
Avoiding coagulation, flocculation & sedimentation DAF: Dissolved Air Flotation
Taste and Odours CH3 OH CH3 Geosmin and MIB Other
Hepatotoxins (liver) Other intestinal toxins Microcystin-LR Cylindrospermopsin Nodularin
Hepatotoxins (liver) Other intestinal toxins Chlorine
Neurotoxins (nervous system) Anatoxin-a Saxitoxin Anatoxin-aS
Monitoring algae and cyanobacteria • WATER QUALITY MONITORING PROGRAM: • Chlorophyll-a(source) & Total photosynthetic pigments (potable) • Phytoplankton identification & enumeration(source & potable) • Cyanotoxin analysis (source and potable) • Microcystin 2011 and 2015 : SANS 241 drinking water std. • Taste & Odour: Geosmin & 2-MIB (source and potable) • Sampling frequency: • Site location (Katse Dam = 3 months; Vaal Dam = 2 weeks; Intakes to plants = daily) • Winter vs. Summer • Incident response (people affected increased sampling)
Chlorophyll-a / Total photosynthetic pigments [Chlorophyll-a] = [(A665 – A750) – (A665a – A750a)] x 28.66 x Ve Vm 8 [TPP] = (A665 – A750) x 133333.333 Vm 1 7 Filter Spectrophotometer 4 6 2 Ethanol or Methanol Vortex & Centrifuge 3 5 78 °C or 60 °C (depending on solvent) Chl-a = R250 per sample (150 samples p.m.) TPP= R200 per sample (550 samples p.m.)
Algae identification and enumeration Species e.g. Anabaena circinalis(in cells/mL) Taxa e.g. Cyanophyceae (in cells/mL) Problems e.g. Toxins; Taste & Odours; Filter clogging (in cells/mL) ID and ENUM = R350 per sample (330 samples p.m.)
Cyanotoxin analysis (Enzyme Linked Immuno Sorbent Assay – ELISA technique) Cyanotoxin = R1100 per sample (100 samples p.m.)
Geosmin and MIB: Organic Chemistry Lab Solid phase extraction and Gas chromatography Geosmin/MIB = R1100 per sample (350 samples p.m.)
On-line instruments • Observator Database • Accessible via www • YSI Multi-parameter Water Quality Sonde • Temperature (°C) • Turbidity (NTU) • pH (pH units) • Conductivity (mS.m-1) • O2 (% saturation and mg.-1) • Chlorophyll-a (µg.-1) • Cyanobacteria (cells.m-1/RFU – Relative Fluorescence units)
What happens to the data? • LIMS (Laboratory Information Management System) • Most methods interfaced, some entries manual • Analyst Technical Signatory Scientist / Laboratory Supervisor / Head Biology Report out of compliance results to the applicable STATION and WQSS • Cyanobacteria Incident Management Protocols: • Cyanotoxins (Microcystin) • Taste and Odour : Geosmin & 2-Methylisoborneol (2-MIB)
Algal related guidelines and standards • IMP: Incident Management Protocols: Microcystin, Taste and Odour (and others) • WHO: World Health Organisation • SANS 241 (2015): SA National drinking water standard
Cyanotoxin Incident Management Protocol ROUTINE MONITORING PROGRAMME: Cyanobacteria identification and enumeration; Chla and TPP analysis; Microcystin analysis; Frequency: At least once every 2 weeks <0.3 µg/L No Cyanobacteria > 2000 cells/mL Yes ALERT LEVEL 1:Analysis frequency 1x per day (at abstraction); Toxin analysis 1x per week on source & final water; Notification to DWTW; Application for discharge permits; Regular surveillance of source; Optional mouse test 0.3 - 0.7 µg/L No Yes No Cyanobacteria > 100 000 cells/mL? Microcystin concentration in the drinking water Yes ALERT LEVEL 2: Analysis frequency once per day (at abstraction); Toxin analysis 1x per day on source and final water; Mouse test at least once per week; Optimise DWTW; Reporting and Communication to response committee; Response Committee Meeting 0.7 - 2.5 µg/L No No Toxic bloom a real threat to consumers? Yes Yes ALERT LEVEL 3:Daily response committee meeting; Analysis 2x p.d.; Daily toxin analysis; Mouse test every 2nd day; Execute actions as per Response Committee ALTERNATIVE WATER SUPPLY: if toxin >2.5 µg/L for 8 consecutive days >2.5 µg/L
Taste and Odour IMP ROUTINE MONITORING PROGRAMME: Photosynthetic Pigments, Geosmin and MIB analysis and Cyanobacteriaidentification and enumeration Frequency: At least once every 2 weeks Geosmin or MIB in the potable water <15 ng/L Consumer complaints Cyanobacteria > 2000 cells/mL Any of the above? No Geosmin or MIB in the potable water 15-30 ng/L Yes ALERT LEVEL 1: Geosmin and MIB analysis more frequently On-site inspections (e.g. boiling tests) Written and verbal, notification to production chemist Pro-active actions for incident preparation No Cyanobacteria > 50 000 cells/mL? Yes Geosmin or MIB in the potable water >30 ng/L ALERT LEVEL 2: Response Committee Meeting: decisions will be taken on treatment and other actions Daily report to Response Committee Members PRIMARY TRIGGER SECONDARY TRIGGER
Case study 1 (GIMP) Vaal Dam on the Wilge River – September 2005 Delmas incident: At least 9 people died and 842 treated for Typhoid infection relating to contaminated borehole water. Microcystis sp. Anabaena sp.
Drinking water at Zuikerbosch >300 consumer complaints I per week
Increase sampling & notify stakeholders Source & potable lines monitored DAILY: Chl, Geosmin, 2-MIB and algae
High geosmin concentrations only at ZB not VG Vereeniging
Water purification at Rand Water VEREENIGING and ZUIKERBOSCH Stations 1 and 2 receive water via a closed pipe system from the Vaal Dam ZUIKERBOSCH stations 3 and 4 receive water via an open canal system from the Vaal Dam
A B S T R A C T I O N V A A L D A M Depth profile : cyanobacteria
Optimising filtration Daily inspections of the filter houses by operators and plant managers Increased filter backwash frequency: 48h36h24h
Increase load from VG; decrease load from ZB Vereeniging
Drain the forebay 93% compliance to <30 ng/L guideline Drain the forebay and allow fresh water to replace stagnant patches
Case study 2 Penetration of cyanobacteria @ Vaalkop (Jan ‘12) • From 3 – 30 January 2012: • 12 000 – 42 000 cells/mL toxic cyanobacteriain the SOURCE WATER • >2 300 cells/mL in the DRINKING WATER • Dam replenished with water from Hartbeespoort Dam • Cyanobacteria Incident Management Protocol – all results reported to the relevant stakeholders • Investigation into the problem
Depth profile at Vaalkop intake Depth profile at Vaalkop-dam intake (Jan 2012) Microcystissp. Merismopediasp. Aphanizomenonsp.
Case study 2 Penetration of cyanobacteria at VK (Jan 2012) • Abstraction level changed from 0m (surface) to 4m below the surface, causing a MAJOR improvement: • 6 Feb 2012: Drinking water2 : 4 cells/mL • 13 Feb 2012: Drinking water1 : no algae detected • Drinking water2 : no algae detected • While the source water still showed concentrations of >26,000 cells/mL of cyanobacteria.
Predicting Anabaena sp. concentration in Vaal Dam 14 days in advance • IF (Conductivity ≤ 15.2) • THEN... • Anabaena14= ((Temp*(pH + DO))*Conductivity) • Temp • ELSE… • Anabaena14= Initial Cyanobacteria inoculum • ((DO2)*(15.530 - Cond))
Anabaena sp. 7 days in advance R2 value=0.81
Anabaena sp. 14 days in advance R2 value=0.76
Satellite remote sensing Matthews, M.W. and Barnard, S. 2015, Eutrophication and cyanobacteria in South Africa’s standing water bodies: A view from space, South African Journal of Science 111 (5/6).
Conclusions: Multi-barrier approach to risk reduction • Monitor (source, treatment, distribution, final water) • React on monitored results (e.g. optimise the water treatment processes) • Incident Management Protocols • Prediction modeling of cyanobacteria blooms • React on predictions (e.g. start preparations in plant to deal with cyanobacteria blooms)
Annelie Swanepoel (Pr.Sci.Nat.) aswanepo@randwater.co.za