Download
1 / 13
130 likes | 245 Views
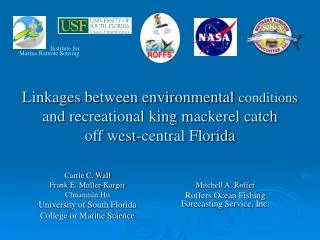
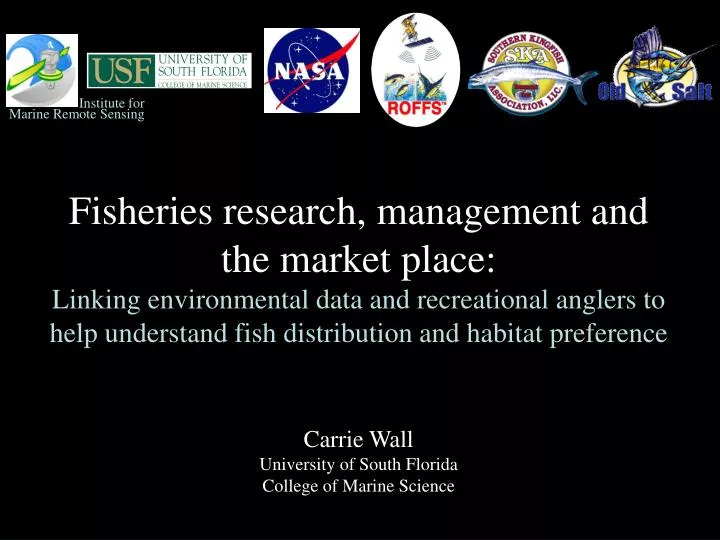
Fisheries research, management and the market place: Linking environmental data and recreational anglers to help understand fish distribution and habitat preference. Institute for Marine Remote Sensing. Carrie Wall University of South Florida College of Marine Science.

E N D
Fisheries research, management and the market place: Linking environmental data and recreational anglers to help understand fish distribution and habitat preference Institute for Marine Remote Sensing Carrie Wall University of South Florida College of Marine Science
Determine the influence of the ocean environment on the distribution and catch rate of king mackerel (Scomberomorus cavalla) http://la.climatologie.free.fr/lexique.htm Objective • Show the utility of routinely using satellite derived oceanographic data to understand coastal circulation and for fisheries management
Fisheries – SurveyWhere are the fish? • What pass did you leave from? • What time? • Where did you start fishing? • What time did you start? • What method of fishing was used? Troll? Anchor? Drift? • Number of fishing lines? • Number of fish hooked? • Number of fish caught? • Were bait fish present? • Did you see kingfish? • What time did you stop? • Did you fish anywhere else? • Did you run to next site?
King Mackerel Catch Data • Spring and fall 2004 to 2005 • 19 tournaments • 415 interviews conducted • 1,599 kingfish reported • 579 fishing locations • Spring and fall 2004 to 2005 • 22 tournaments • 666 interviews conducted • 2,008 kingfish reported • 792 fishing locations • Compared to: • oceanographic data from satellites • meteorological data from buoys
Remote Sensing • Sea Surface Temperature • AVHRR + MODIS • Chlorophyll concentrations • MODIS + SeaWiFS • Proxy for available biomass • Water-leaving radiance at 443 nm • MODIS + SeaWiFS • Water clarity index • Fluorescence Line Height • MODIS • Red tide
DegC 25 17 Frontal Detection Sea Surface Temperature (SST) 9 April 2005 • Adapted 2 automated frontal detection algorithms • Cayula and Cornillon (1992) • SST • Water clarity • Fluorescence line height • Canny Method (1986) • Chlorophyll concentration
mW cm-2 µm-1 sr-1 Tampa Bay 0.15 0.01 Fall 2005 and Red Tide • Decreased catch • Spring 2004: 444 • Fall 2004: 818 • Spring 2005: 538 • Fall 2005: 208 • Decreased observance of baitfish • Spring 2004: 54% • Fall 2004: 54% • Spring 2005: 51% • Fall 2005: 38% • Decreased water clarity FLH fronts November 12, 2005
Conclusions • High variability within fisheries data • Data from satellites and anglers successfully used to link environmental conditions to daily fisheries distribution • Continue to strengthen link between scientists and fisheries community
Implications Working together towards sustainable fisheries • Increased trust of the fishing community will yield more accurate and reliable data leading to better management policies • Better managed fish stocks will lead to a sustainable ecosystem ensuring the health of the fisheries
Acknowledgements • NASA grant # NNGO4GF13G; The Old Salt Marine Biology Scholarship courtesy of Florida Sea Grant, the Old Salt Fishing Foundation, and the Alyesworth Foundation for the Advancement of Marine Sciences, Inc. and the USF Paul L. Getting Memorial Fellowship • SCOR for supporting my nomination to attend ICSU • Southern Kingfish Association (Jack and Deona Holmes), The Old Salt Fishing Foundation (Tom Verdensky and Jill Foraker), the Alyesworth Foundation (Bob and Dawn Alyesworth), Treasure Island Charities (Doyce Mathis), and Billy’s Stone Crab Restaurant (Billy Moore and Steve Fennell) • Dozens of friends and colleagues who assisted in the tournament data collection, the hundreds of anglers who disclosed the intimate details of their fishing activity, and the thousands of king mackerel who unknowingly bit the “wrong” bait