Download
1 / 28
280 likes | 477 Views
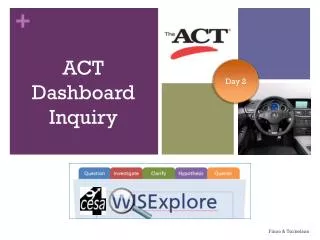
Day 2. Attendance Dashboard Inquiry. ATTENDANCE Entry Points. School Report Card. Attendance Rate All and lowest attending subgroup Chronic Absenteeism Rate. ATTENDANCE Question Topics. Which questions are most important to explore?. About the ATTENDANCE Dashboard.

E N D
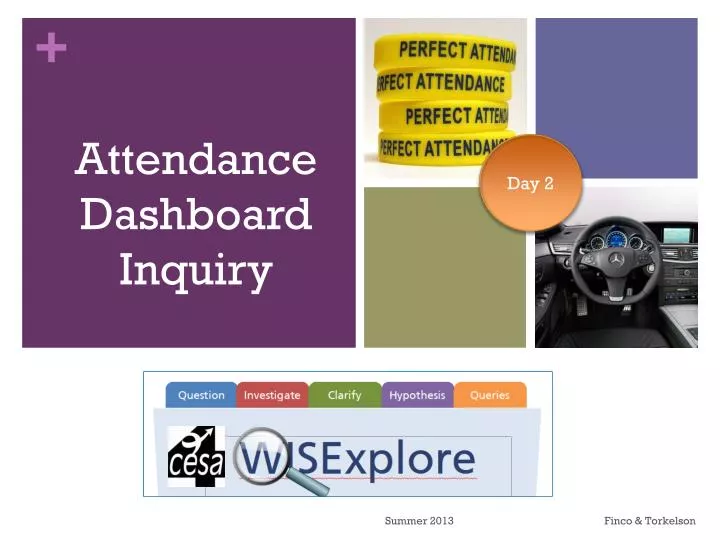
Day 2 Attendance Dashboard Inquiry Finco & Torkelson
ATTENDANCEEntry Points • School Report Card • Attendance Rate • All and lowest attending subgroup • Chronic Absenteeism Rate Finco & Torkelson
ATTENDANCE Question Topics • Which questions are most important to explore? Finco & Torkelson
About the ATTENDANCE Dashboard • Use the filters to view the attendance rates for subgroups. • View year-by-year trends. Finco & Torkelson
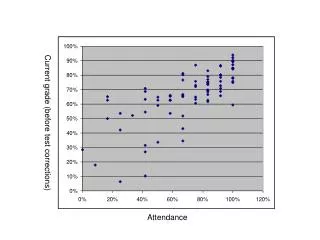
Thinking Ahead about“Drilling-Down” • Some helpful “drill-down” investigations when studying “attendance.” • Who are the low-attending students? • How do attendance patterns align with WSAS achievement patterns? • Respect confidentiality. Save data in a secure data folder. Finco & Torkelson
ATTENDANCE Data Inquiry – Get Started • Go to your data inquiry ATTENDANCE question to start. • Follow the four inquiry steps. Finco & Torkelson
Use the Fillable Form to Guidethe Data Inquiry Process • QUESTION • Enter your data question and select the data source • INVESTIGATE • Enter WISEdash. Navigate and apply filters to find the data picture that answers the data question. • CLARIFY • Document data findings. Fill in the areas indicated on the Fillable Form. • HYPOTHESIZE • Pose and categorize hypotheses of teacher and leadership practices related to the data findings. Finco & Torkelson
Reflecting… • What did you learn through this Inquiry Process? Finco & Torkelson
Access Dashboard Inquiry Finco & Torkelson
ACCESS Question Topics • Which questions are most important to explore? Finco & Torkelson
Thinking Ahead about“Drilling-Down” • Because WISEdash allows you to “drill down” to specific students, think ahead about the role that the ACCESS LEP levels play in planning for students.. • Respect confidentiality. Save data in a secure data folder. • Student Lists • Will you need lists of … • Students who are at different ACCESS levels in the four domains? • Students who are at levels one and two overall? • Student Profiles • Will you need individual student data such as … • Specific language domain results and history? • ELL student performance on the WSAS to relate to ACCESS results? Finco & Torkelson
Demo – Drilling Down intoACCESS Data • Example: Entry screen for ACCESS results • Note – take time to study the color coding of results. • Use caution when interpreting longitudinal patterns— annual ”newcomer” families can greatly alter these reports • Check “Enrollment” data to view the shifts in population over time. Finco & Torkelson
Demo – Drilling Down to theStudent Profile Example: • Note the ACCESS test history and details for the student. • Note the varying levels of English proficiency based on domain (reading, writing, speaking, listening) • Note the sorting functionality of column headings. Finco & Torkelson
ACCESS Data Inquiry – Get Started • Go to your data inquiry ACCESS question to start. • Follow the four steps. Finco & Torkelson
Use the Fillable Form to Guidethe Data Inquiry Process Fillable Form • QUESTION • Enter your data question and select the data source • INVESTIGATE • Enter WISEdash. Navigate and apply filters to find the data picture that answers the data question. • CLARIFY • Document data findings. Fill in the areas indicated on the Fillable Form. • HYPOTHESIZE • Pose and categorize hypotheses of teacher and leadership practices related to the data findings. Finco & Torkelson
Reflecting… • What did you learn through this Inquiry Process? Finco & Torkelson
What? So What? Now What? Finco & Torkelson
Fillable Form on CESA 4 Website Finco & Torkelson
Don’t Forget Your Exit Ticket! • We want and need your feedback!