Download
1 / 9
90 likes | 111 Views
Explore the ESP Solar Flare Model providing estimates of solar proton flux, essential for accurate radiation dose predictions. The model, based on actual observations and averaged results, caters to varying confidence levels and energy ranges from 1 to 300 MeV. Enhance your satellite radiation damage simulations with this vital tool. Obtain mission-specific integral proton fluence data and confidently assess the solar radiation risk. Join the quest for a better model with the ESP Model.

E N D
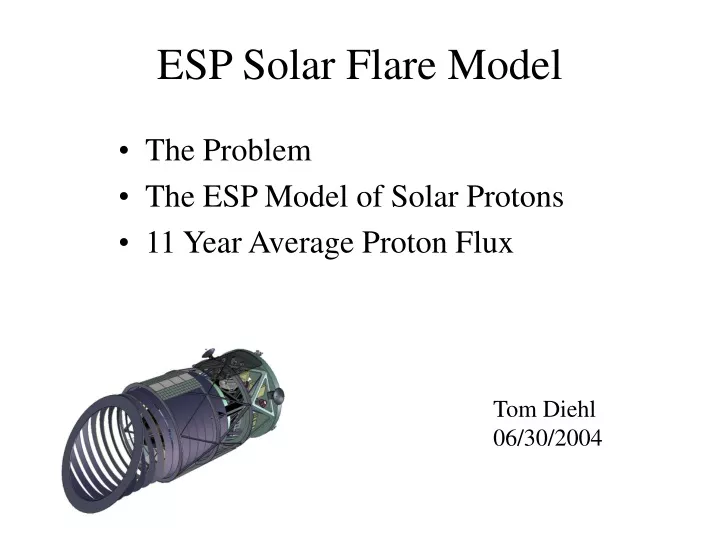
ESP Solar Flare Model • The Problem • The ESP Model of Solar Protons • 11 Year Average Proton Flux Tom Diehl 06/30/2004
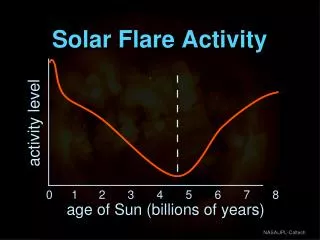
Solar Cycle Projection • NGST Radiation Environmrnt: Barth, Isaacs, Poivey http://www.ngst.nasa.gov/public/unconfigured/doc_0570/rev_04/ngstradenv2.pdf • Solar flares and coronal mass ejections originate with the “sunspots” • Plot on left is projected sunspot count. • See large variation in solar activity. Est. Sunspot Activity vs. Year (2009-2020)
The Problem • Creme96 simulation provides • Galactic cosmic ray fluences at solar minimum and solar maximum • Worst 5 minutes, day, & week of solar flares • These are the extrema and the expected radiation dose varies from 7 rads/yr to 200 rad/day. • We need a better model if we are to provide a spec. for radiation dose.
“Emission of Solar Protons” Model • I came across it in an NASA memo “The Radiation Environment … GOES-R Series Satellites”, 417-R-RPT-0027 (March 2004) and in NGST radiation estimates, both by Janet Barth and Mike Xapsos. • They referenced their model. http://trs.nis.nasa.gov/archive/00000505/01/tp209763.pdf has the write-up and http://see.msfc.nasa.gov/ire/model_esp.html provides a link to software distribution.
ESP Model & Results • Input Ranges 1970-2020 and 50%-99% • Results from 1970 to 1999 are based on actual observations. • Results from 2000 on are averaged over previous years in the solar cycle.
ESP Model & Results • Four part output: Proton Flux vs. C.L. for several C.L. and also the user C.L., same for worst case solar event. • Energy range is 1 MeV to 300 MeV (k.e.) 2 // TYPE (1=Input,2=Output) 1998,1999,90 //INPUTS (Start Year,End Year,Confidence Level) TOTAL PROTON FLUENCE FOR MISSION Results for a mission of 1998 to 1999.(2 Active Years) GENERAL CONFIDENCE LEVEL TABLE ------------------------------------------------------------------ Integral Proton Fluence(cm^-2) Energy Levels Confidence Levels() (>MeV) 80 85 90 95 99 ------------- --------- --------- --------- --------- --------- 1 2.44E+011 2.89E+011 3.56E+011 4.85E+011 8.68E+011 3 8.62E+010 1.02E+011 1.27E+011 1.74E+011 3.17E+011 5 5.09E+010 6.16E+010 7.82E+010 1.11E+011 2.16E+011 . . . . . . . . . . . . . . . . . . 275 2.03E+007 3.02E+007 4.97E+007 1.04E+008 4.19E+008 300 1.59E+007 2.37E+007 3.91E+007 8.20E+007 3.29E+008
Proton Flux 2004-2015 • ESP Model provides solar proton flux estimates in energy range 1 to 300 MeV at distance averaged at 1 A.U. • Provides any combination of years from 1988xx to 2020 and 50% or higher c.l. flux.
ESP Model - Plan • Incorporporate this flux into MARS • Get an update of the model from Mike Xapsos that goes to higher energy • Overnighter to IEEE conference in Atlanta; I’ve arranged to meet M.X.
Summary • Obtained “ESP Model” used by experts to simulate proton fluences from solar events in radiation damage simulations for satellites at L2. • It solves the extrema problem and will allow us to make reasonable estimates of the doses. • I plan to obtain an extension to the model from the authors.