Download
1 / 28
280 likes | 430 Views
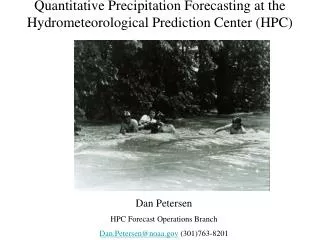
Exploring the Use of Object-Oriented Verification at the Hydrometeorological Prediction Center. Faye E. Barthold 1,2 , Keith F. Brill 1 , and David R. Novak 1 1 NOAA/NWS/Hydrometeorological Prediction Center 2 I.M. Systems Group, Inc. What is Object-Oriented Verification?.

E N D
Exploring the Use of Object-Oriented Verification at the Hydrometeorological Prediction Center Faye E. Barthold1,2, Keith F. Brill1, and David R. Novak1 1NOAA/NWS/Hydrometeorological Prediction Center 2I.M. Systems Group, Inc.
What is Object-Oriented Verification? • Considers the relationship between individual precipitation areas instead of performance over an entire forecast grid • Methods • Neighborhood • Scale separation • Features based • Field deformation
Why use Object-Oriented Verification? • Avoids “double penalty” problem • Traditional verification penalizes forecast both for missing the observed precipitation and for giving a false alarm • Provides additional information about why a forecast was correct or incorrect • Spatial displacement, axis angle difference, etc. • Goal is to evaluate forecast quality in a manner similar to a forecaster completing a subjective forecast evaluation
Method for Object-Based Diagnostic Evaluation (MODE) • Part of the Model Evaluation Tools (MET) verification package from the Developmental Testbed Center (DTC) • Defines “objects” in the forecast and observed fields based on user-defined precipitation thresholds • Tries to match each forecast object with an observed object based on the similarity of a variety of object characteristics • Matching determined by user-defined weights placed on a number of parameters • Interest value—objects are matched when their interest value is ≥ 0.70
Convolution radius Merging threshold Interest threshold Centroid distance Convex hull distance Area ratio Complexity ratio Intensity ratio Area threshold Maximum centroid distance Boundary distance Angle difference Intersection area ratio Intensity percentile Configuration Parameters
MODE Output false alarm miss Forecast Objects Observed Objects unmatched objects matched matched matched
MODE at HPC • Running daily at HPC since April 2010 • 24hr QPF • 6hr QPF (September 2010) • Supplements traditional verification methods • Training opportunities • Provide spatial information about forecast errors • Quantify model biases • COMET COOP project with Texas A&M
Forecaster Feedback • Too much smoothing of the forecast and observed fields, particularly at 32 km • Sizeable areas of precipitation not identified as objects • Trouble capturing elongated precip areas
HPC Forecast Stage IV Forecast Observed Large forecast and observed areas >1in but only small objects identified 1” (25.4 mm) threshold 1” (25.4 mm) threshold
Forecaster Feedback • Too much smoothing of the forecast and observed fields, particularly at 32 km • Sizeable areas of precipitation not identified as objects • Trouble capturing elongated precip areas • Interest value difficult to interpret • Seems to be higher for high resolution models than for operational models
EAST_ARW Forecast Stage IV Forecast Observed Interest value: 1.000 0.25” (6.35 mm) threshold 0.25” (6.35 mm) threshold
Forecaster Feedback • Too much smoothing of the forecast and observed fields, particularly at 32 km • Sizeable areas of precipitation not identified as objects • Trouble capturing elongated precip areas • Interest value difficult to interpret • Seems to be higher for high resolution models than for operational models • Matches between small and large objects have unexpectedly high interest values
HPC Forecast Stage IV Forecast Observed Why are these objects matched? (Interest value: 0.7958) 0.25” (6.35 mm) threshold 0.25” (6.35 mm) threshold
Forecaster Feedback • Too much smoothing of the forecast and observed fields, particularly at 32 km • Sizeable areas of precipitation not identified as objects • Trouble capturing elongated precip areas • Interest value difficult to interpret • Seems to be higher for high resolution models than for operational models • Matches between small and large objects have unexpectedly high interest values • What is the line around some groups of objects?
EAST_NMM Forecast Stage IV Forecast Observed What does line around objects mean? 0.25” (6.35 mm) threshold 0.25” (6.35 mm) threshold
Configuration Changes • Eliminate area threshold requirement* • GOAL: prevent small objects (<10 grid squares) from being automatically removed from the analysis • Increase weighting on boundary distance parameter • GOAL: give more credit to objects that are in close proximity to one another • Increase weighting on area ratio parameter • GOAL: prevent very large objects from being matched with very small objects • Hazardous Weather Testbed configuration* • Iowa State configuration * operational only * high resolution only
Original Configuration(0.25 inch threshold) Forecast Objects Observed Objects Why are these objects matched? (Interest value: 0.7671)
Configuration Change: Increase Boundary Distance Parameter Weight(0.25 inch threshold) Forecast Objects Observed Objects Objects are still matched (Interest value: 0.8109)
Configuration Change: Increase Area Ratio Parameter Weight(0.25 inch threshold) Forecast Objects Observed Objects Objects are now unmatched (Interest value: 0.6295)
Configuration Change: Increase Both Boundary Distance and Area Ratio Parameter Weight(0.25 inch threshold) Forecast Objects Observed Objects Objects remain unmatched (Interest value: 0.6882)
Hazardous Weather Testbed Configuration(0.25 inch threshold) Forecast Objects Observed Objects
Iowa State Configuration(0.25 inch threshold) Forecast Objects Observed Objects Objects are unmatched (Interest value: N/A)
Challenges • MODE is highly configurable • Difficult to determine which parameters to change to get the desired results • Interest values difficult to understand • Seem to be resolution-dependent • No point of reference for the difference between an interest value of 0.95 and 0.9 • Does interest value of 1.0 indicate a perfect forecast? • MODE generates large amounts of data
Future Work • Determine the ideal configuration to use with 6hr verification • Examine multiple cases across all seasons • Make graphical output available online to allow for easier forecaster access • Make 24hr verification available in real time for HPC/CPC daily map discussion • Investigate MODE performance in cool season events • Make better use of text output
References Davis, C., B. Brown, and R. Bullock, 2006: Object-based verification of precipitation forecasts. Part I: Methodology and application to mesoscale rain areas. Mon. Wea. Rev., 134, 1772-1784. Gallus, W.A., 2010: Application of object-based verification techniques to ensemble precipitation forecasts. Wea. Forecasting, 25, 144- 158. Gilleland, E. D. Ahijevych, B. G. Brown, B. Casati, and E. E. Ebert, 2009: Intercomparison of spatial forecast verification methods. Wea. Forecasting, 24, 1416-1430. Model Evaluation Tools (MET) was developed at the National Center for Atmospheric Research (NCAR) through grants from the United States Air Force Weather Agency (AFWA) and the National Oceanic and Atmospheric Administration (NOAA). NCAR is sponsored by the United States National Science Foundation.