Download
1 / 28
280 likes | 397 Views
Montana Regional Ground – Water Monitoring Program. Montana Bureau of Mines and Geology. RAIN. GROUND - WATER FLOW SYSTEMS. WELL. SPRING. STREAM. AQUIFER. GROUND WATER FLOW DIRECTION GROUND WATER PRESSURE. CLINKER OR SCORIA. Hanging Woman Creek Coal Field

E N D
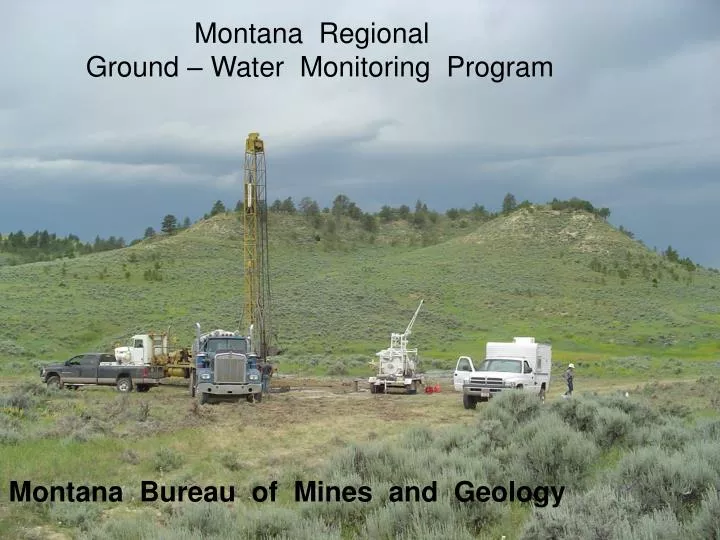
Montana Regional Ground – Water Monitoring Program Montana Bureau of Mines and Geology
RAIN GROUND - WATER FLOW SYSTEMS WELL SPRING STREAM AQUIFER GROUND WATER FLOW DIRECTION GROUND WATER PRESSURE CLINKER OR SCORIA
Hanging Woman Creek Coal Field ( from USGS WRI 83-4260) 300 200 Shale Coal Sandstone 100 0 100 200 0 2 miles 300 Feet Scale
Miles City Forsyth Powder North Dakota South Dakota Yellowstone River Tongue Montana Wyoming Belle Fourche River Very simplistic : Ground water flows Generally north North Platte River Casper
Miles City Forsyth Powder North Dakota South Dakota Yellowstone River Tongue Montana Wyoming Belle Fourche River Very simplistic : Discharge to : Streams Outcrops Wells North Platte River Casper
Powder River Basin, Montana Cross Section 1 South to North North South Wyoming Montana Tongue River Member Lebo Member Yellowstone River CBM Ground – Water Flow
Miles City Locate ( ! ! ( Yellowstone Powder River Tongue River Lebo Shale Ashland Flowers- Goodale ! ( ! ( Broadus Birney King Broadus Knobloch ! ( Wall Pawnee Cache Montana Canyon Dietz Moorhead Anderson Cook Smith Wyoming ! ( Decker Roland
Stratigraphic intervals for water supply wells 2,779 supply wells in the Tongue River Mbr 10 - 15 gpm typical
R . 4 1 E . R . 3 7 E . R . 3 9 E . R . 4 3 E . R . 4 5 E . R . 4 7 E . # # Y # # # # # T . 1 S . # Y Y # # Y # L a m e D e e r [ % T . 2 S . Ashland Y # # [ % Y # N o r t h e r n C h e y e n n e I n d i a n R e s e r v a t i o n [ % ð ð ð Busby ð ð C u s t e r N a t i o n a l ð F o r e s t T . 4 S . # ð # [ % B i r n e y D a y S o n n e t t e % [ S c h o o l ð ð ð ð ð ð ð ð ð ð ð ð Rosebud Creek ð ð ð C r o w I n d i a n ð ð ð ð R e s e r v a t i o n # Y # Y Kirby ð B i r n e y ð [ % [ % Y # Y # ð ð ð Y # # Y ð Y # ð ð ð Y # Y # ð Y # ð T . 6 S . Y # Tongue River O t t e r # % [ # Y # Y # Y # Y # Y ð ð ð ð ð ð Y # Powder River ð ð ð ð ð ð ð ð Quietus ð ð ð # ð ð ð ð Springs Wells State line wells ð ð ð ð ð ð T T . 8 S . [ % ð ð ð # ð ð ð ð ð [ % ð ð ð # ð ð ð Moorhead ð ð ð ð ð ð ð ð ð ð ð ð ð ð ð ð ð ð ð N ð Y # ð ð ð ð ð ð ð ð ð ð ð ð ð ð ð ð ð ð ð ð ð ð ð ð ð ð ð ð ð ð ð ð ð ð ð ð ð ð ð ð ð ð ð ð ð ð ð ð ð ð ð ð ð ð ð ð Decker ð ð ð ð ð ð ð ð ð ð ð ð ð ð ð ð % [ ð ð ð ð ð ð ð ð ð ð ð ð ð ð ð ð ð ð ð ð ð ð ð ð ð ð ð ð ð ð 2 0 0 2 0 4 0 M i l e s
Site SL-3 Sandstone Smith Coal Anderson Coal Canyon Coal
Idealized water level response Coal mining drawdown and recovery CBM drawdown
Modeled drawdown Anderson Coal, in well field +500 0 -50 -100 -150 -200 Water level drawdown (feet) 0 10 20 30 40 50 60 Years
Stratigraphic relationships Ground surface Anderson coal Dietz 1 Coal Dietz 2 Coal Altitude (feet amsl) Figure 26. In some locations, the water level response to CBM production in deeper coal seams (PKS-1179) is far greater than in shallower coal seams (WRE-12 and WRE-13). This trend has been noted in coal mining areas also. Note the vertical scales of the stratigraphic relationship and the hydrograph are different.
Stratigraphic relationships Ground surface Shallow sandstone Anderson-Dietz overburden Anderson-Dietz Coal Altitude (feet amsl)
Stratigraphic relationships Ground surface at WO-1 Ground surface at WO-4 Sandstone between Knobloch Coal beds Alluvial Lowest Knobloch Coal bed Sandstone below Knobloch Coal bed Altitude (feet amsl) Figure 9. Bedrock aquifers at the Otter creek area have an upward vertical gradient, flowing wells are common in the area. The alluvial well appears to show the general seasonal water year cycle. Note the vertical scales of the stratiographic relationship and the hydrograph are different.
Location Map W E N Otter Road WO-2 (Knob) WO-3 (SS) Fifteen mile road WO-1(SS) Otter Creek Otter Creek Channel WO-4 WO-8 WO-9 WO-11 WO-10 SS Alluvium Shale Knobloch Coal Shale Sandstone (SS) Shale Figure 8. Geologic cross section for the Otter Creek alluvium and bedrock wells located in T05S R45E sec 23. Water levels in the alluvium are lower than the underlying bedrock aquifers. The water levels in the bedrock wells completed in stratigraphically deeper units are higher than those in shallower units. The water levels for this cross section were taken in December, 2006. Vertical exaggeration is 9.6:1.
E W SL-8-3Q N SL-8-1Q SL-8-2Q Powder River Road Powder River Powder River Alluvium Bedrock Figure 13. Cross section of alluvial wells south of Moorhead near the Powder River located in T09S R47E section 25. Ground water in the alluvium appear to flow parallel to the river. Water levels for this cross section were taken in January 2006. Vertical exaggeration is 58:1.
Figure 14. Ground-water flow in the alluvial aquifer at SL-8 site is roughly parallel to the Powder River. The water-level trends also follow surface stream flow trends. The lowest altitude for the Powder River channel bottom is 3381 ft.
371 ac-ft 230 gpm 0.5 cfs 71 ac-ft 44 gpm 0.1 cfs 3165 ac-ft 1962 gpm 4.4 cfs MT WY 3736 ac-ft 2316 gpm 5.2 cfs 6576 ac-ft 4076 gpm 9.1 cfs 1798 ac-ft 1115 gpm 2.5 cfs
Primary changes on ground - water quality in the Fort Union Formation 1. Salt Dissolution 2. FeS2 Oxidation 3. Cation Exchange 4. Sulfate Reduction CO3 - HCO3 3. 4. 2. CBM Produced Water 1. 3 SO4 - Cl Na - K 2 Increasing TDS Ca - Mg 4 1 TDS Changes
GROUND - WATER QUALITY ALONG FLOW PATHS IN THE FORT UNION FORMATION Calcite dissolution Sulfide oxidation Ion Exchange Sulfate reduction Ca, HCO3: Low TDS (EC), Low SAR Ca, SO4: Moderate - High TDS (EC), Low SAR Na, SO4: Moderate - High TDS (EC), Increasing SAR Na, HCO3: Moderate TDS (EC), High SAR
0 5 15 25 35 45 55 4800 4300 3800 3300 2800 2300 1800 1300 800 Cross section along the Montana – Wyoming state line Hanging Woman Creek Powder River Tongue River A B 4800 4300 3800 3300 2800 2300 1800 1300 800 C D E H J F G I Lebo Shale Member Coal beds identified in cross section A Roland B Smith C Anderson D Dietz E Canyon F Carney Coal G Wall Coal H Knobloch I Roberts Coal J Kendrick
Montana Water Production CBM Produced - water discharge rate, normalized per month EIS Estimated Water Production Reported Water Production
Reduced water pumping rates in western parts of CX field Ash Creek Mine begins dewatering Reclamation began Figure 22. Water levels in the combined Anderson and Dietz coal (WR-34) in the Squirrel Creek area respond to both coal mining and coalbed methane production. The water level recovered during 2004 in response to water production decreases in this portion of the CX field.