Download
1 / 10
100 likes | 357 Views
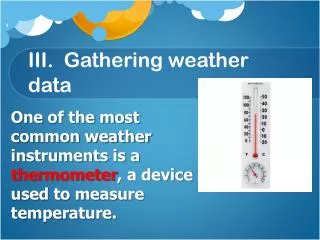
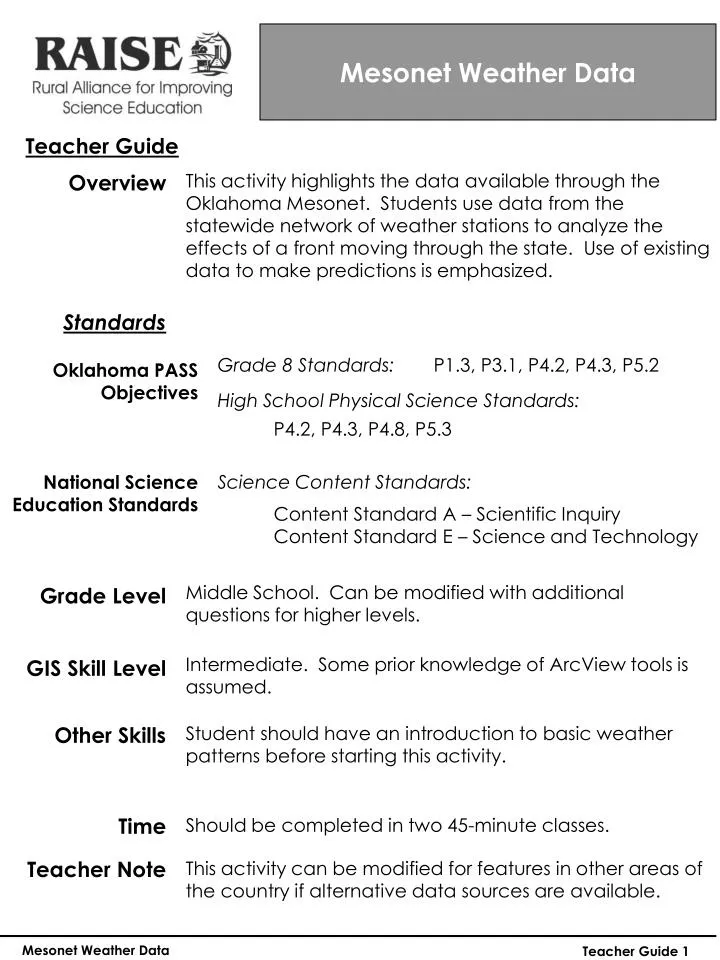
Mesonet Weather Data. Teacher Guide. This activity highlights the data available through the Oklahoma Mesonet. Students use data from the statewide network of weather stations to analyze the effects of a front moving through the state. Use of existing data to make predictions is emphasized.

E N D
Mesonet Weather Data Teacher Guide This activity highlights the data available through the Oklahoma Mesonet. Students use data from the statewide network of weather stations to analyze the effects of a front moving through the state. Use of existing data to make predictions is emphasized. Overview Standards P1.3, P3.1, P4.2, P4.3, P5.2 Grade 8 Standards: Oklahoma PASS Objectives High School Physical Science Standards: P4.2, P4.3, P4.8, P5.3 National Science Education Standards Science Content Standards: Content Standard A – Scientific Inquiry Content Standard E – Science and Technology Middle School. Can be modified with additional questions for higher levels. Grade Level Intermediate. Some prior knowledge of ArcView tools is assumed. GIS Skill Level Other Skills Student should have an introduction to basic weather patterns before starting this activity. Time Should be completed in two 45-minute classes. Teacher Note This activity can be modified for features in other areas of the country if alternative data sources are available. Mesonet Weather Data Teacher Guide 1
Mesonet Weather Data Teacher Guide Materials This activity relies on several GIS datasets that are not available in the ESRIDATA directory from a standard installation of ArcView. The files and the designed directories are listed below: C:\ESRI\projects\MesonetWeather C:\ESRI\ESRIDATA\USA\OK temp_grd.avl okcounty.shp temp_pt.avl Note: Shapefiles (.shp) require additional reference files (.shx, .dbf, .prj) not listed above. UTC060204.dbf ok_mesonet.shp C:\ESRI\projects\MesonetWeather\GRID Temp_utm17 Temp_utm21 Temp_utm18 Temp_utm22 Temp_utm19 Temp_utm23 Temp_utm20 Temp_utm24 Sources • Oklahoma Mesonet – www.mesonet.org • Premium Subscribers – Mesonet Data Files • Sites – Oklahoma Mesonet Shapefile Lesson Preparation This project relies upon data available for download at the Oklahoma Mesonet website. The data must first be obtained from the Mesonet and put into a logical .dbf file for use with ArcView. The GRID files were created from the downloaded data set once it was attached to the Mesonet Site shapefile. For more advanced students, the project could involve creating their own GRID rasters using the Surface Tools with the Spatial Analyst Extension. The Oklahoma County shapefile can be clipped from a larger US County file if needed. Developed by Steve O’Connell geographilia@hotmail.com Mesonet Weather Data Teacher Guide 2
Mesonet Weather Data The Oklahoma Mesonet collects many different weather measurements. Meteorologists and forecasters at the National Weather Service and local news stations use this data to create the weather maps and forecast graphics you see each day on the television or online. Weather does not take a break and new weather information is always being processed by forecasters. It takes a trained eye to analyze and quickly relay this information to a weather-wary public. In this activity you will use data collected by the Mesonet on June 2, 2004. On that day a unique and fast-moving system pushed through much of Oklahoma, causing dramatic changes in temperature, wind speed, and humidity in a short period of time. In real-time, forecasters were able to build weather models and predict the changes as they occurred. You will be able to view the weather models to learn what patterns forecasters use to make their predictions.
Step 1 Getting Started To begin, open ArcView GIS 3.3 by selecting the icon on your desktop. At the Welcome menu, select ‘Open An Existing Project’. Navigate to the following directory: c:\esri\projects\MesonetWeather Open the weather.apr file. Mesonet Weather Data 2
Step 2 Adding Weather Data Your project should open with a view of Oklahoma and the 116 Mesonet sites. To view the weather data for June 2, 2004, the data table has been added to the Mesonet Sites theme. The original theme table has information on the site location. The weather data table that is added has information from Mesonet Sites for the following readings: Relh#### - Relative Humidity (%) Tair#### - Air Temperature (C) Wspd#### - Wind Speed (MPH) Wdir#### - Wind Direction (compass Degrees from North) Pres#### - Pressure (millibars) Srad#### - Solar Radiation Tb05#### - Temperature (C) 5cm below bare soil Step 3 Plotting a Temperature Chart To review the temperature change in the data, the first step would be to review a chart plotting the information. A Temperature chart is part of this activity. Highlight the Mesonet site for Stillwater on the map, and then open up the Temperature chart. The chart that opens is not very useful for our purposes. Change the format of the table to a basic Line Chart using the first option in the Line Chart Gallery menu. Click on the Title to rename the chart to something more appropriate. 1. What name did you choose for your table? Mesonet Weather Data 3
Step 3 Plotting a Temperature Chart (cont) ReSize the chart so you can read the time values listed along the bottom. Notice that the numbers for time start at 00 and go to 24. These numbers represent Coordinated Universal Time, or UTC (also known as Zulu Time or Greenwich Mean Time). The time in Oklahoma during June is UTC-6 hours; example: 1200 (noon) UTC = 600 (6AM)Central Daylight Time (CDT) in Oklahoma. 2. What are the beginning and ending dates and times represented on this chart, in Central Daylight Time? Step 4 More on Coordinated Universal Time UTC is utilized around the world in many aspects of scientific data collection. It is based on the time at the Prime Meridian (0 Longitude) in Greenwich, England. The UTC notation is typically given in one 24 hour cycle day, instead of our normal two 12 hour cycle day. 3. Why would some people find the use of UTC important or useful? 4. What are some organizations or groups that might use UTC? Step 5 Back to the Temperature Chart On your map, highlight Medford, Stillwater, and Okemah (hold down Shift to highlight more than one site). Return to the Temperature Chart. 5. At what time (CDT) does the large temperature drop occur in Medford? Stillwater? Okemah? Mesonet Weather Data 4
Step 6 Creating a Weather Map We can use the data in the table to create maps showing the large temperature drop that took place on this day. Enter the Legend Editor for the Mesonet Site theme and click the Load… button to load a saved legend. Select the temp_pt.avl file from the project directory and select the Air Temperature for 11 AM CDT from the field list. 6. What is the temperature range that is represented by the points on the map? These points show us the temperature at each Mesonet site, but this is not how we normally see a temperature map on a weather broadcast. Computers can create maps that shade in areas where specific data is unknown; this is called interpolation – the unknown values are assumed based on the known readings nearby. Step 7 Weather Modeling To see some interpolated maps, we will view the GRID themes that are part of the activity. You should see these themes in the Table of Contents labeled temp_utc17 through temp_utc24. They are in order, bottom to top. Turn on the GRID temperature theme for 11 AM CDT. The color scheme is the same as for the Mesonet Sites point theme. 7. Is it easier to see the different temperature ranges across Oklahoma using the point theme (Mesonet Sites) or the grid theme (temp_utm17)? Why? Mesonet Weather Data 5
Step 7 Weather Modeling Each of the subsequent GRID images represent the temperature at one hour intervals for the remainder of the day (UTM time). You should notice that all of the temperature Grids are rectangular in shape, which means they include a portion of the Texas panhandle. 8. Do you think the temperatures shown for the Texas panhandle are correct? Why or why not? Turn off and on the Grid themes so you can view them in their proper order. It is plain to see the cold air moving across much of the middle and eastern part of the state. 9. What type of front does this weather event show happening? 10. If you were a weather broadcaster on KOTV’s Noon news, what kind of forecast would you give for Tulsa area residents as you sign-off the program at 1PM? 11. Name a city located on the edge of the front at Noon CDT; at 1PM; at 2PM. Mesonet Weather Data 6
Step 8 Weather Station Models Now we’ll return to the cities we first looked at. An important aspect of weather modeling is the review of past weather events with a standard technique. The weather station model, seen below, is one of example of standard weather mapping. 12. Following the basic model seen above, create weather station models for Medford, Stillwater, and Okemah for 11AM CDT and 1PM CDT. You should finish with six weather models. (Use the chart on the next page to determine the dew point.) Mesonet Weather Data 7
Dew Point Table Chart from: LAMTEC Dew Point Calculator. www.lamtec.com/dew-point-calculator.htm Chart 1 Mesonet Weather Data 8