Download
1 / 18
230 likes | 481 Views
Electron spin resonance measurement of sapphire for KAGRA mirrors. Nobuhiro Fukumoto , Yukinori Ono a , Masahiro Hori a , Ryo Chikaoka a , Yosuke Hayakawa a , Shigenori Moriwaki and Norikatsu Mio Photon Science Center, Univ. of Tokyo

E N D
Electron spin resonance measurement of sapphire for KAGRA mirrors Nobuhiro Fukumoto, Yukinori Onoa, Masahiro Horia, Ryo Chikaokaa, Yosuke Hayakawaa, Shigenori Moriwaki and Norikatsu MioPhoton Science Center, Univ. of Tokyo a Graduate School of Science and Engineering Univ. of Toyama, Toyama
Japanese gravitational wave detectionproject KAGRA Gravitational wave Propagating as space strain Strain is very small No evidence of direct observation Gravitational wave interferometer Huge Michelson interferometer Efforts for decreasing noises ・mono-crystal sapphire mirror space strain(plus mode) KAGRA interferometer Sapphire mirror
Mono-crystal sapphire mirror • Demerit • ・IR (infrared) absorption • Byimpurities • (Fe3+ , Cr3+ ,Ti3+ …) • Sample IR absorption • →30~680ppm /cm • KAGRA requirement • →50ppm /cm Merit ・low mechanical loss (lower at cryogenic measurement) ・high thermal conductivity We need information about impurities in Mono-crystal sapphire
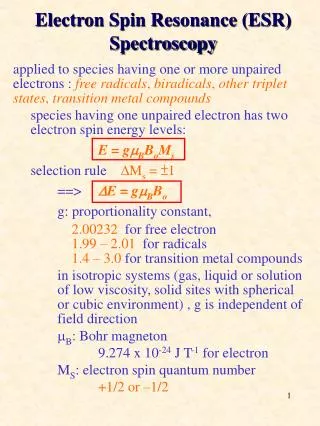
Electron Spin Resonance(ESR) Theory ・Solve degeneracy by external field absorption condition :Energy of microwave : Lande - factor : magnetic moment Energy level transition (Free Electron)
Electron Spin Resonance(ESR) Setup ・Cavity Excite standing microwave ・Electromagnet Sweep external field Standing microwave fields Inside of cavity High sensitive measurement observing each spin
Instruments Setup ESRmeasurement instruments (Graduate School of Science and Engineering Univ. of Toyama ,Ono.lab) microwave frequency:9.38 GHz(X-band) Sweeping magnetic Field:0~10 kG ESR instrument Electromagnet and cavity
Sample preparation Crystals for IR absorption measurement High IR absorption crystal(680 ppm/cm): AC150 Low IR absorption crystal (30 ppm/cm): P401 Cut samples for ESR measurement Cut into 27 blocks(from A1 to C9) C-axis IR absorption crystal diameter: 10mm length: 40mm Sample cutting
Measurement Summary We have measured 27 x 2=54 samples. ESR peak summary ESR peaks at 3 regions around 2 kG around 3 kG around 5 kG Comparison of peaks between samples among blocks Measurement condition Temperature: room temperature Microwave power: 1mW Microwave frequency: 9.38GHz
Around 2kG Intensity(a.u.) P401_A8 AC150_A3 Peak 1705G Peak 1930G Field(G) Each peak position is different→ different origin
Around 3kG P401_A8 Peak: 3345G Intensity(a.u.) AC150_A3 Peak: 3345G Field(G) Peak at the same position
Around 3kG, another block P401_C8 Intensity(a.u.) AC150_C3 Field(G) No peak→ depend on position
Around 5kG Intensity(a.u.) P401_A1 AC150_A3 Peak: 5233G Field(G) Only high absorption sample has peak →possibility of contribution to IR absorption
C A B A B C Peak intensity distribution around 3 kG AC150 P401 Red: High Yellow: Middle Blue: Low Peakintensitydistributiondiagram Intensity is largest at red part and decreases with distance→possibility oflocal impurity/affix in cutting
Identification of impurity High Low Both Conversion peak position (calculated from g-value) Cr3+ Ti3+ Fe3+ 9.50GHz RT (b):RT R. S. de BIAS1 and D. C. S. RODRIGUESJ. Am. Cerum. Soc.,68 [7] 409 (1985) Around C1 and C2, high IR absorption sample has peak, but around C2it has no peak. Around F3,both samples has peak , but around F1 and F2,they has no peak. Radiation Measurements43 (2008) 295 – 299 Around Ti3+peak, samples have peak, but, these peaks are same as Fe3+ case.
Summary We observed ESR signals of the samples fabricated from the mono-crystals of different IR absorptions. We observed peaks with intensity dependence on the block position around 3kG. It may come from local impurity or affix in cutting. We observed peaks from only high IR absorption crystal sample around 5kG. It can be related to IR absorption.
Future work We have not identified the impurity yet. In order to do so,we will prepare mono-crystal samples in which impurities (Fe3+, Ti3+ Cr3+…) are intentionally doped and measure them for impurity identification.