Download
1 / 66
660 likes | 808 Views
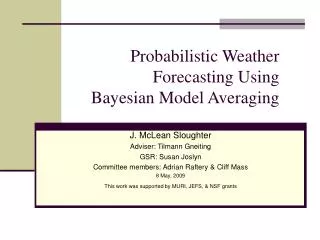
Probabilistic Forecasting in Practice. J. Paul Dallavalle AMS Short Course on Probabilistic Forecasting San Diego, CA January 9, 2005. Operational Probabilities. BALTIMORE WASHINGTON INTERNATIONAL KBWI GFS MOS GUIDANCE 11/19/2004 1200 UTC

E N D
Probabilistic Forecasting in Practice J. Paul Dallavalle AMS Short Course on Probabilistic Forecasting San Diego, CA January 9, 2005
Operational Probabilities • BALTIMORE WASHINGTON INTERNATIONAL • KBWI GFS MOS GUIDANCE 11/19/2004 1200 UTC • DT /NOV 19/NOV 20 /NOV 21 /NOV 22 • HR 18 21 00 03 06 09 12 15 18 21 00 03 06 09 12 15 18 21 00 06 12 • N/X 49 58 48 64 42 • TMP 58 57 54 52 52 52 52 54 56 56 54 53 53 52 51 58 62 61 54 48 44 • DPT 51 51 51 50 51 52 52 52 52 52 53 52 51 50 49 50 49 47 47 40 38 • CLD OV OV OV OV OV OV OV OV OV OV OV OV OV BK BK BK BK BK SC FW BK • WDR 36 06 09 09 08 09 09 11 13 13 17 00 28 29 29 31 30 30 30 31 31 • WSP 01 02 01 01 02 03 04 03 02 02 01 00 02 02 04 07 09 07 04 05 05 • P06 44 57 48 34 38 4 6 2 1 1 5 • P12 63 40 10 2 5 • Q06 1 1 1 1 1 0 0 0 0 0 0 • Q12 1 0 0 0 0 • T06 2/ 8 5/ 0 2/ 0 0/ 0 0/13 0/ 0 0/ 0 0/ 0 1/14 0/ 0 • T12 5/ 8 2/ 0 1/14 0/ 0 1/15 • POZ 0 0 0 0 0 0 0 0 0 0 0 0 0 0 0 0 0 0 0 0 0 • POS 0 0 0 0 0 0 0 0 0 0 0 0 0 0 0 0 0 0 0 0 0 • TYP R R R R R R R R R R R R R R R R R R R R R • SNW 0 0 0 • CIG 7 6 6 5 3 3 3 3 3 3 4 4 5 6 8 6 6 7 8 8 8 • VIS 6 6 6 5 5 3 3 4 5 5 5 5 5 5 2 7 7 7 7 7 7 • OBV N N N BR BR BR BR BR BR BR BR BR BR FG FG N N N N N N
Covert Probabilities • BALTIMORE WASHINGTON INTERNATIONAL • KBWI GFS MOS GUIDANCE 11/19/2004 1200 UTC • DT /NOV 19/NOV 20 /NOV 21 /NOV 22 • HR 18 21 00 03 06 09 12 15 18 21 00 03 06 09 12 15 18 21 00 06 12 • N/X 49 58 48 64 42 • TMP 58 57 54 52 52 52 52 54 56 56 54 53 53 52 51 58 62 61 54 48 44 • DPT 51 51 51 50 51 52 52 52 52 52 53 52 51 50 49 50 49 47 47 40 38 • CLD OV OV OV OV OV OV OV OV OV OV OV OV OV BK BK BK BK BK SC FW BK • WDR 36 06 09 09 08 09 09 11 13 13 17 00 28 29 29 31 30 30 30 31 31 • WSP 01 02 01 01 02 03 04 03 02 02 01 00 02 02 04 07 09 07 04 05 05 • P06 44 57 48 34 38 4 6 2 1 1 5 • P12 63 40 10 2 5 • Q06 1 1 1 1 1 0 0 0 0 0 0 • Q12 1 0 0 0 0 • T06 2/ 8 5/ 0 2/ 0 0/ 0 0/13 0/ 0 0/ 0 0/ 0 1/14 0/ 0 • T12 5/ 8 2/ 0 1/14 0/ 0 1/15 • POZ 0 0 0 0 0 0 0 0 0 0 0 0 0 0 0 0 0 0 0 0 0 • POS 0 0 0 0 0 0 0 0 0 0 0 0 0 0 0 0 0 0 0 0 0 • TYP R R R R R R R R R R R R R R R R R R R R R • SNW 0 0 0 • CIG 7 6 6 5 3 3 3 3 3 3 4 4 5 6 8 6 6 7 8 8 8 • VIS 6 6 6 5 5 3 3 4 5 5 5 5 5 5 2 7 7 7 7 7 7 • OBV N N N BR BR BR BR BR BR BR BR BR BR FG FG N N N N N N
Outline • Model Output Statistics (MOS) • Definitions • Properties • Regression Estimation of Event Probabilities (REEP) • Predictand definitions • Appropriate predictors • Developmental considerations • Application in an operational environment • Sample forecasts • Subjective probabilities
A SIMPLE STATISTICAL MODEL Relative frequency of 12-24 h precipitation occurrence as a function of forecast relative humidity 1.0 0.9 3-YR SAMPLE; 200 STATIONS 0.8 1987-1990 COOL SEASON 0.7 0.6 47% OBSERVED REL. FREQUENCY 0.5 0.4 0.3 0.2 0.1 0.0 0 10 20 30 40 50 60 70 80 90 100 FCST MEAN RELATIVE HUMIDITY (%)
Model Output Statistics (MOS) • Relates observations of the weather element to be predicted (predictand) to appropriate variables (predictors) via a statistical method • Predictors include: • NWP model output • Prior observations • Geoclimatic data – terrain, normals, etc. • Current statistical method: multiple linear regression (forward selection)
Properties of MOS Development • Mathematically simple, yet powerful • Models non-linearity through NWP variables and predictor transformations • Uses record of observations at forecast points • Applies equations to future run of similar forecast model • Produces probability forecasts from a single run of the underlying NWP model • Can use other mathematical methods such as logistic regression or neural networks
Regression Estimation of Event Probabilities (REEP) • Define the meteorological variable (predictand) • Define the event in terms of categories of the predictand • Transform predictand to a 0 (event does not occur) or a 1 (event occurs) • Develop regression model relating predictand to predictors • Interpret regression fit in terms of estimated relative frequencies, i.e., probabilities
Event Definition 1 12-24 H PRECIPITATION ≥ .01" 0 10 20 30 40 50 60 70 80 90 100 12-24 H FCST 1000 - 500 MB RH
Simple Linear Regression Fit 1 RV=36.5% 12-24 H PRECIPITATION ≥ .01" 0 10 20 30 40 50 60 70 80 90 100 12-24 H FCST 1000 - 500 MB RH
Regression Estimation of Event Probabilities 1 3 Events P = 30% RF= 30% 12-24 H PRECIPITATION ≥ 01" 0 7 Events 10 20 30 40 50 60 70 80 90 100 12-24 H FCST 1000 - 500 MB RH
Properties of MOS Probabilities • Unbiased –average of probabilities over a period of time equals long-term relative frequency of the event • Reliable – conditionally (“piece-wise”) unbiased over the range of probabilities • Reflects predictability of event – range of probabilities narrows and approaches relative frequency of event as predictability decreases, with increasing projections or rare events
Probability Considerations • So, if the MOS probability represents the long-term relative frequency of the event, what is the event definition ??? • Meteorological element • Characteristics of the observing system • Point or areal extent • Temporal resolution • Categorical breakpoints • Conditional on another event
Suitable observations? Appropriate Sensor? Real ? Good siting? Photo Courtesy W. Shaffer
Snowfall GuidanceDealing with Observational Systems • PORT HOPE, MI • KP58 GFSX MOS GUIDANCE 1/09/2004 0000 UTC • FHR 24| 36 48| 60 72| 84 96|108 120|132 144|156 168|180 192 • FRI 09| SAT 10| SUN 11| MON 12| TUE 13| WED 14| THU 15| FRI 16 CLIMO • X/N 10| 5 17| 14 33| 26 29| 13 15| 3 6| 2 11| 8 17 12 28 • TMP 8| 8 16| 20 31| 27 23| 15 12| 5 6| 4 10| 10 16 • DPT -2| 1 3| 19 24| 22 15| 8 4| 1 -3| -6 1| 7 6 • CLD OV| OV OV| OV OV| OV OV| OV PC| OV OV| OV OV| OV OV • WND 13| 8 7| 11 13| 13 12| 15 14| 13 12| 11 12| 12 11 • P12 12| 12 18| 49 75| 60 38| 46 28| 17 21| 28 25| 20 23999999 • P24 | 18| 75| 83| 51| 32| 38| 29 999 • Q12 0| 0 0| 1 1| 1 0| 1 0| 0 0| 0 | • Q24 | 0| 1| 2| 1| 0| | • T12 2| 1 0| 1 1| 2 0| 0 0| 0 0| 0 0| 0 0 • T24 | 2 | 1 | 9 | 1 | 1 | 2 | 1 • PZP 0| 0 0| 0 0| 0 2| 0 0| 0 0| 0 1| 1 2 • PSN 100|100 100|100 99| 88 90|100 100| 99 100| 98 96| 96 95 • PRS 0| 0 0| 0 0| 12 9| 1 0| 1 1| 2 3| 2 1 • TYP S| S S| S S| S S| S S| S S| S S| S S • SNW | 1| 2| 2| 2| | |
MOS Snowfall GuidanceObservations from Co-op Observer Network
Challenges of the Co-op Network Station Selection: Some sites don’t report snowfall amount Some sites open (or close) during the sample period Some sites “move” either horizontally or vertically during the sample period Some sites report neither accurately nor reliably
More Challenges of the Co-op Network Station Reporting Time: Sites report once in a 24-hr period Reporting times are site-specific and are in local time Other hydrological elements are sometimes reported separately Reporting times change at some sites during the sample period
“12Z Window” “00Z Window” • Strategy • Arrive at one “official” reporting time per site • Discard any site with multiple reporting times or multiple locations • Two distinct “windows” • 12Z: 11 – 17Z, 00Z: 21 – 3Z • Discard any site outside the two windows
Creating Predictand EventsLightning strikes are summed over the “appropriate” time period and assigned to the center of “appropriate” grid boxes = thunderstorm = no thunderstorm
What is “appropriate” for thunderstorms? • Time period? • 1 hour • 2 hours • 3 hours • 6 hours • 12 hours • Grid size? • 5 km • 10 km • 20 km • 40 km • 120 km
More Categorical Breakpoints • Ceiling Height • Category 1: < 200 ft • Category 2: 200 – 400 ft • Category 3: 500 – 900 ft • Category 4: 1000 – 1900 ft • Category 5: 2000 – 3000 ft • Category 6: 3100 – 6500 ft • Category 7: 6600 – 12000 ft • Category 8: > 12000 ft • Visibility • Category 1: < 0.5 mi • Category 2: 0.5 mi - < 1 mi • Category 3: 1 - < 2 mi • Category 4: 2 - < 3 mi • Category 5: 3 – 5 mi • Category 6: 6 mi • Category 7: > 6 mi KLNS GFS MOS GUIDANCE 11/29/2004 1200 UTC • DT /NOV 29/NOV 30 /DEC 1 /DEC 2 • HR 18 21 00 03 06 09 12 15 18 21 00 03 06 09 12 15 18 21 00 06 12 • ... • CLD CL BK BK BK OV OV OV OV OV OV OV OV OV OV OV OV OV BK CL CL CL • ... • CIG 8 8 8 8 7 7 7 8 8 7 7 7 4 2 3 3 6 7 8 8 8 • VIS 7 7 7 7 7 7 7 7 7 7 7 7 5 5 4 2 6 7 7 7 7 • ...
Conditional Probabilities • If event B is conditioned upon A occurring, then: • Prob(B/A)=Prob(AB)/Prob(A) • or: Prob(B/A)=Prob(C)/Prob(A) U A B C
Conditional Event Probabilities • If event B is conditioned upon A occurring, then: • Prob(B/A)=Prob(AB)/Prob(A) • or: Prob(B/A)=Prob(B)/Prob(A) • Examples: • If precipitation occurs, what is the probability that freezing rain will occur? • If precipitation occurs, what is the probability that 0.25 inches or more will occur? U U B B A
Conditional Predictands • Precipitation type (condition: precipitation occurrence) • freezing (FZDZ,FZRA,PL,mixtures) • snow (SN or SG) • liquid (RA,DZ,mixtures) • NOTE: exclusive and exhaustive • Precipitation amount (condition: > 0.01 inches of precip.) • > 0.10 inches • > 0.25 inches • > 0.50 inches • > 1.00 inches • > 2.00 inches • NOTE: not exclusive, but exhaustive
Predictor Considerations • Describe physical processes associated with event • thunderstorms: CAPE, K-index, vertical velocity, etc. • Avoid irrelevant variables • thunderstorms: 1000-500 hPa thickness • Use event relative frequencies or high-resolution geophysical variables (terrain) that contribute to local forcing of event • Mimic forecaster thought process • thunderstorms: interact relative frequency and K-index • Provide non-linear transforms of predictors
Transform - Point Binary Predictor FCST 12-24 H MEAN RH PREDICTOR CUTOFF = 70%INTERPOLATE; STATION RH ≥ 70% , SET BINARY = 1; BINARY = 0, OTHERWISE 96 86 89 94 87 73 76 90 KCMH • (71%) 76 60 69 92 64 54 68 93 RH ≥70% ; BINARY AT KCMH = 1
Linear Regression – Point Binary Predictor Only 1 RV=36.5% 12-24 H PRECIPITATION ≥ .01" RV=42.4% 0 10 20 30 40 50 60 70 80 90 100 12-24 H FCST 1000 - 500 MB RH
Linear Regression – Cont. & Point Binary Predictors POP = -0.234 + (0.007RH) + (0.478BINARY RH (70%)) 1 RV=44.9% RV=36.5% 12-24 H PRECIPITATION ≥ .01" RV=42.4% 0 10 20 30 40 50 60 70 80 90 100 12-24 H FCST 1000 - 500 MB RH
Transform - Grid Binary Predictor FCST 12-24 H MEAN RH PREDICTOR CUTOFF = 70%WHERE RH > 70%, SET GRIDPOINT VALUE = 1; = 0, OTHERWISE; INTERPOLATE TO STATION 1 1 1 1 1 1 1 1 KCMH • (.21 ) 1 0 0 1 0 0 0 1 0 ≤ VALUE AT KCMH ≤ 1
Transform – Logit Fit KPIA (Peoria, IL) 0000 UTC; 18-h projection
Development in the Real World • Selection and quality control of the observational dataset • Precise definitions of predictand and conditioning (if any) events • Simultaneous development for related predictands • precipitation type: • freezing • snow • liquid • Note1: exclusive and exhaustive • Note2: sum of 3 probabilities should = 1
More Developmental Considerations • Choice of appropriate predictors • Number of terms in the equation – selection criteria • Multi-collinearity • Overfit • Stratification of developmental sample • Forecast cycle • Projection • Season (cool, warm; winter; spring, summer, cool)
Issues with the Developmental Sample • Size of sample • Representativeness of sample • Stability of sample • Frequency of event • - is event rare? • Pooling of data • - regionalized equations • - station specificity
Regionalized Probability Equations • BALTIMORE WASHINGTON INTERNATIONAL • KBWI GFS MOS GUIDANCE 11/19/2004 1200 UTC • DT /NOV 19/NOV 20 /NOV 21 /NOV 22 • HR 18 21 00 03 06 09 12 15 18 21 00 03 06 09 12 15 18 21 00 06 12 • N/X 49 58 48 64 42 • TMP 58 57 54 52 52 52 52 54 56 56 54 53 53 52 51 58 62 61 54 48 44 • DPT 51 51 51 50 51 52 52 52 52 52 53 52 51 50 49 50 49 47 47 40 38 • CLD OV OV OV OV OV OV OV OV OV OV OV OV OV BK BK BK BK BK SC FW BK • WDR 36 06 09 09 08 09 09 11 13 13 17 00 28 29 29 31 30 30 30 31 31 • WSP 01 02 01 01 02 03 04 03 02 02 01 00 02 02 04 07 09 07 04 05 05 • P06 44 57 48 34 38 4 6 2 1 1 5 • P12 63 40 10 2 5 • Q06 1 1 1 1 1 0 0 0 0 0 0 • Q12 1 0 0 0 0 • T06 2/ 8 5/ 0 2/ 0 0/ 0 0/13 0/ 0 0/ 0 0/ 0 1/14 0/ 0 • T12 5/ 8 2/ 0 1/14 0/ 0 1/15 • POZ 0 0 0 0 0 0 0 0 0 0 0 0 0 0 0 0 0 0 0 0 0 • POS 0 0 0 0 0 0 0 0 0 0 0 0 0 0 0 0 0 0 0 0 0 • TYP R R R R R R R R R R R R R R R R R R R R R • SNW 0 0 0 • CIG 7 6 6 5 3 3 3 3 3 3 4 4 5 6 8 6 6 7 8 8 8 • VIS 6 6 6 5 5 3 3 4 5 5 5 5 5 5 2 7 7 7 7 7 7 • OBV N N N BR BR BR BR BR BR BR BR BR BR FG FG N N N N N N
Operational 12-h PoP EquationMid-Atlantic, cool season, valid 12-24h after 00Z • Probability = C0 + C1X1 + C2X2 + … • All variables are grid binaries; mean RH is from 1000-700 hPa • Equation based on 11286 cases • Reduction of variance =.617
Sample 12-h PoP EquationBWI, cool season, valid 12-24h after 00Z • Probability = C0 + C1X1 + C2X2 + … • Variable is a grid binary; breakpoint of 0.05 inches • Equation based on 361 cases; 84 precip. events • Reduction of variance =.639
Operational Precip. Type EquationsMid-Atlantic, valid 18h after 00Z • Probability = C0 + C1X1 + C2X2 + … • Note: Trans. Thk. Is a function of 1000-850 hPa thk. • Thk. Is a grid binary of the 1000-925 hPa thk.
Truncating Probabilities • 0 < Prob (A) < 1.0 • Applied to PoP’s and thunderstorm probabilities • If Prob(A) < 0, Probadj (A)=0 • If Prob(A) > 1, Probadj (A)=1.
Normalizing Categorical Probabilities • Sum of probabilities for exclusive and exhaustive categories must equal 1.0 • If Prob (A) < 0, then sum of Prob (B) and Prob (C) = D, and is > 1.0. • Set: Probadj (A) = 0, • Probadj (B) = Prob (B) / D, • Probadj (C) = Prob (C) / D