Download
1 / 40
400 likes | 415 Views
Explore retirement trends, superannuation coverage, carer demographics, employment rates, and future challenges of an ageing population in Australia. Discover statistics on primary carers, elderly carers, and the impact on income and expenses.

E N D
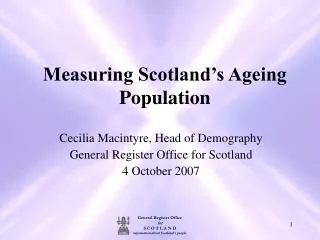
Population Ageing • Future population growth and ageing • Retirement and retirement intentions • Trends in superannuation coverage
From around 21 million people in 2006, Australia’s population is projected to grow to: • Between 30.9 million and 42.5 million in 2056 • Between 33.7 million and 62.2 million in 2101
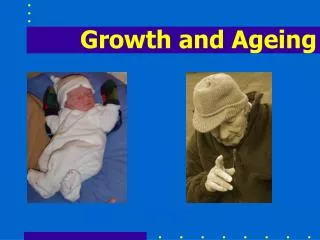
Currently: 5 working age people for every retirement age person • In 50 years: 2½ :1
Retirement • 1 million people will retire in the next 10 years • Women retire younger than men • 15% of workers never intend to retire • People are planning to work for longer • Most common reason for retirement? Health
A Profile of Carers in Australia • Four main sources: • Survey of Disability, Ageing and Carers • ABS 2006 Census of Population and Housing • How Australians use their time; and • General Social Survey • Further information in the Survey of Employment Arrangements, Retirement and Superannuation. cat no 4448.0 Released 14 October 2008
Carers age profile — 2003 Source: ABS 2003 Survey of Disability, Ageing and Carers
Disability — 2003 Source: ABS Survey of Disability, Ageing and Carers
Primary carers Primary carers • 475,000 primary carers in 2003 • 19% of all carers • 71% of primary carers were female • Often related to the person they were caring for
Reasons primary carers took on a carer role — 2003 Source: ABS 2003 Survey of Disability, Ageing and Carers
Indigenous status of carers — 2006 Source: ABS 2006 Census of Population and Housing
PRIMARY CARERS, average hours spent caring per week by age of main recipient of care—2003 Source: ABS 2003 Survey of Disability, Ageing and Carers
Time spent on domestic activities — 2006 Source: ABS 2006 Time Use Survey
Community involvement —2006 Source: 2006 General Social Survey
Employment Employment • Two-thirds of carers aged 15-64 were employed compared with around three-quarters of non-carers • Carers more likely to work part-time
Low income households — 2003 Source: ABS 2003 Survey of Disability, Ageing and Carers
Financial stress — 2006 Source: ABS 2006 General Social Survey
Reasons primary carers had left work just before taking on caring role — 2003
Reasons primary carers had left work to commence or increase care — 2003
Young carers Young adult carers • In 2003, around 246,000 young carers aged 15-24 years. • Around 19,000 of these were primary carers. • Those aged 19-24 were less likely to have completed year 12 than non-carers • Slightly higher rates of part-time work than non-carers. • Less time on leisure than non-carers • More time on domestic activities
Carers aged 35-54 years Carers aged 35–54 years • Around 1 million (18%) in 2003 • Among people aged 35-54 years, 14% were caring for 1 person and 4% for two or more people. • Women had higher carer rates than men (21% compared with 15%)
Older carers Older carers • In 2003, 18% of all carers were aged 65+ • 24% of primary carers aged 65+ • 83% of older primary carers who lived with the recipient were assisting their spouse • 61% of these older carers had a disability themselves
In the future? Number of carers needed expected to increase: • particularly with the ageing population • movement towards shorter hospital stays, • emphasis on ‘ageing in place’ and staying in the community rather than using institutional care.
Future issues of AST Coming up… • Will include articles on: • Homelessness (June) • Health literacy (June) • Carers (Sept) • Risk factors for chronic disease: obesity, smoking, alcohol (Sept)
Further information • www.abs.gov.au • Australian Social Trends • ABS catalogue number 4102.0 • Linda Fardell • linda.fardell@abs.gov.au • Phone: (02) 6252 7187 • Dr Paul Jelfs • paul.jelfs@abs.gov.au • Phone: (02) 6252 6690