Download
1 / 33
330 likes | 422 Views
Learn the basics of consumer theory, properties of preferences, marginal utility, MRS formula, and budget constraints. Master the art of maximizing utility within a budget, all while understanding consumer preferences and decision-making.

E N D
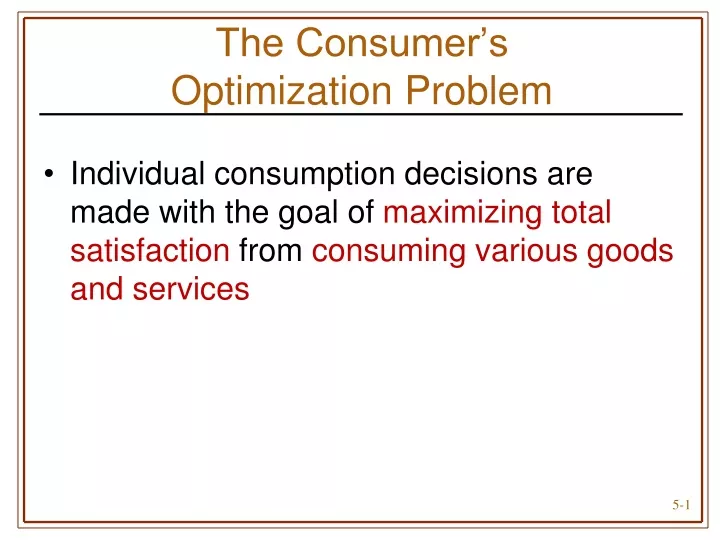
The Consumer’s Optimization Problem • Individual consumption decisions are made with the goal of maximizing total satisfaction from consuming various goods and services
Consumer Theory • Assumes buyers are completely informed about: • Range of products available • Prices of all products • Capacity of products to satisfy • Their income
Indifference Curves • Locus of points representing different bundles of goods, each of which yields the same level of total utility • Negatively sloped & convex
Properties of Consumer Preferences • Completeness • For every pair of consumption bundles, A and B, the consumer can say one of the following: • A is preferred to B • B is preferred to A • The consumer is indifferent between A and B
Properties of Consumer Preferences • Transitivity • If X is preferred to Y, and Y is preferred to Z, then Xmust be preferred to Z
Properties of Consumer Preferences • Nonsatiation • More of a good is always preferred to less
Utility • The benefits consumers obtain from the goods and services they consume is called utility. • A utility function shows an individual’s perception of the utility level attained from consuming each conceivable bundle of goods
Marginal Utility • Addition to total utility attributable to the addition of one unit of a good to the current rate of consumption, holding constant the amounts of all other goods consumed • MU= Changes in Total Utility / Change in No of Units Consumed
• A 45 • B • D E • IV R III C • II 15 T I Constrained Utility Maximization (Figure 5.8) 50 Quantity of pizzas 40 30 20 10 0 10 20 30 40 70 80 90 100 50 60 Quantity of burgers
Marginal Rate of Substitution • MRS shows the rate at which one good can be substituted for another while keeping utility constant • Negative of the slope of the indifference curve • Diminishes along the indifference curve as X increases & Y decreases • Ratio of the marginal utilities of the goods
How to get MRS Formula • U = ƒ(XY) (Here, U= Utility; X,Y= 2 goods) by differentiation, dU= ƒ1dX + ƒ2dY Here, ƒ1= ΔU/ ΔX = MUx ƒ2= ΔU/ ΔY = MUy as per indifference curve, U remains constant. So, U = 0 → ƒ1dX + ƒ2dY = 0 → ƒ1dX = - ƒ2dY → ƒ1 / ƒ2 = - dX/dY as indifference curve is neutral, so…. IdX/dYI = I ƒ1 / ƒ2 I = MUx/ MUy So, MRSxy = MUx/ MUy
A 600 T 320 I T’ B 360 800 Slope of an Indifference Curve & the MRS (Figure 5.3) Quantity of good Y C (360,320) 0 Quantity of good X
Before, − ΔY /ΔX = 5/10 or 1/ 2, After, − ΔX/ ΔY = 10/5 or 2 10:5 or 2:1 5 10
Consumer’s Budget Line • Shows all possible commodity bundles that can be purchased at given prices with a fixed money income or
Typical Budget Line (Figure 5.6) • A Quantity of Y B • Quantity of X
R 120 A 100 F 80 C D B Z N 125 160 250 200 240 Panel B – Changes in price of X Shifting Budget Lines (Figure 5.7) A 100 Quantity of Y Quantity of Y B 200 Quantity of X Quantity of X Panel A – Changes in money income
The following figure shows a portion of a consumer’s indifference map. The consumer faces the budget line ZL, and the price of Y is $20. 600 The consumer's income = $__________. The price of X is $_____________. 20
The following figure shows a portion of a consumer’s indifference map. The consumer faces the budget line ZL, and the price of Y is $20. The equation for the budget line ZL is Y = ______________________. 30 - 1x 30/ 30
The following figure shows a portion of a consumer’s indifference map. The consumer faces the budget line ZL, and the price of Y is $20. What combination of X and Y would the consumer choose? Why? 15X and 15Y
The following figure shows a portion of a consumer’s indifference map. The consumer faces the budget line ZL, and the price of Y is $20. The marginal rate of substitution at the combination in part c is __________. MRS=Px / PY = 20 / 20 = 1
The following figure shows a portion of a consumer’s indifference map. The consumer faces the budget line ZL, and the price of Y is $20. If the budget line pivots to ZM, the consumer chooses _______ units of good X and _________ units of good Y. 10 15
The following figure shows a portion of a consumer’s indifference map. The consumer faces the budget line ZL, and the price of Y is $20. Along budget line ZM, the price of X is $_________ and the price of Y is $________. 20 30
The following figure shows a portion of a consumer’s indifference map. The consumer faces the budget line ZL, and the price of Y is $20. MRS= 30/ 20 =1 The new MRS is equal to __________.
The figure below shows a portion of a consumer’s indifference map, and a budget line. The consumer’s income is $1,200 and the price of Y is $6. Using the given budget line, what is one point on the consumer’s demand for X? (Both Price & Quantity) Px = $1,200/200 = $6 and X = 100
The figure below shows a portion of a consumer’s indifference map, and a budget line. The consumer’s income is $1,200 and the price of Y is $6. Pivot the budget line and derive two other points on the consumer’s demand for X. At A, Px = $1,200/100 = $12 and X = 50 At B, Px = $1,200/200 = $6 and X = 100 At C, Px = $1,200/300 = $4 and X = 150
Market Demand • Market demand is a list of prices and the quantities consumers are willing and able • to purchase at each price in the list, other things being held constant. • Marketdemand is derived by horizontally summing the demand curves for all the individuals in the market.
3 0 0 0 5 1 8 1 3 4 5 10 6 7 12 8 10 13 Derivation of Market Demand 3 $6 6 5 12 4 19 3 25 2 31 1