Download
1 / 23
230 likes | 390 Views
Development and validation of vibration source requirements for TMT to ensure AO performance. Hugh Thompson and Doug MacMartin AO4ELT3 Conference, Florence, Italy 26-31 May 2013. Presentation Outline. TMT AO error budget for vibration Sensitivity of TMT structure to vibration

E N D
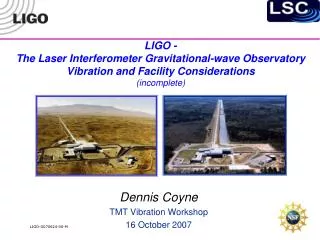
Development and validation of vibration source requirements for TMT to ensure AO performance Hugh Thompson and Doug MacMartin AO4ELT3 Conference, Florence, Italy26-31 May 2013
Presentation Outline • TMT AO error budget for vibration • Sensitivity of TMT structure to vibration • Examples of observatory vibration sources • Are
Rough scale of the problem • Many current AO systems are limited by vibration • ALTAIR on Gemini sees vibration of ~10 mas rms after correction • Survey of similar problems at several telescopes: Caroline Kulcsár ; Gaetano Sivo ; Henri-François Raynaud ; BenoîtNeichel ; FranҫoisRigaut, et al."Vibrations in AO control: a short analysis of on-sky data around the world", Proc. SPIE 8447, Adaptive Optics Systems III, 84471C (September 13, 2012) • For TMT the entire on-axis NFIRAOS budgeted wavefront error of 187 nm corresponds to only ~ 5 mas of tip/tilt
How do we flow AO requirements down? Segment dynamic displacement (due to vibration) 10nm Telescope image jitter (due to vibration) 10nm equivalent to 0.275 mas ? Pump impeller Balance Grade 6.3
The questions in more detail • What is the sensitivity of image quality to vibration? • How does this vary with amplitude, frequency and location? • What are the worst expected sources of vibration with respect to these sensitivities? • What can be done to mitigate them? • Do we need to increase AO error budget allocation to vibration? • What standards/requirements do we have/will we develop to maintain acceptable vibration levels? • How will we assess and verify vibration performance against predictions?
Finite Element Model • FEM of telescope structure includes nodes for each M1 segment, M2, M3 and each instrument • Optical sensitivity combined with nodal motions from FEM determines performance effects due to: • image jitter • M1 segment motion
Additional model details • AO rejection curves included (median conditions) • 15 Hz Type II controller for tip/tilt • 63 Hz DM bandwidth • No additional narrowband rejection • Frequency-resolved calculations are smoothed • Reasonable estimate of rms performance, not worst case • Using simple ground transmission estimates (no soil and pier model) • No direct transmission path measurements for comparison (either soil or on telescopes) • Instruments modeled as lumped masses • wrong above ~12 Hz
Modelling Goals • Determine allowable vibration source amplitudes • Assess: • Relative influence of location of sources • Main contributors to image jitter (M1, M2, M3, focal plane) • Sensitivity to source input frequency
Modelled Sources • “Unit” forces are input at 6 locations • Pier • Also covers sources in facility building with an additional factor to account for attenuation through soil • Instruments (NFIRAOS, MIRES) on Nasmyth platforms • Laser Service Enclosure (LSE) • Cable wraps (Az and El)
Results combining M1 and image motion • After smoothing, after AO rejection Pier forcing NFIRAOS forcing • In both cases image motion is dominantabove 10 Hz
Check spatial correctability on M1 • M1 response at 30 Hz • AO spatial correctability isgood; correction isdominated by temporal bandwidth nm/N
Combined M1 and image motion for all sources Telescope AO rejection Mass effect 10x Pier
Model Results Summary • All modeled telescope sources are roughly comparable in effect • Pier forcing a factor of 10 less impact • Locations in facility building likely reduce sources by an additional factor of 5-10 relative to pier • Performance most sensitive to forces 5-20 Hz • M1 soft actuators reduce M1 response at 30 Hz by factor of 10 • Motion of M2 largest contributor to image motion above 10 Hz • Residual dominated by image motion, not M1 above 10 Hz • Means that feed-forward of M2 motion may be effective • Narrowband rejection of tones may also help • Internal flexibility of instruments not accounted for
Compare actual sensitivity with fit to shaping filter for each source • FilterW(f): • f1=5 Hz • f2=20 Hz
Vibration Budget Specification on rms force after filtering by shaping filter (allows higher vibration at low or high frequency)
Source example ESO study of cryocoolers: “Low-vibration high-cooling power 2-stage cryocoolers for ground-based astronomical instrumentation” GerdJakob, Jean-Louis Lizon Proc. SPIE. 7733, Ground-based and Airborne Telescopes III 77333V (July 16, 2010) • Forces ~1N at 1- 2 Hz • Frequency is low but higher harmonics can be problematic • Large numbers required for TMT has led us to turbine expander cooling with no low-frequency reciprocating motion
Source examplein the summit facilities • 4-pole induction motors on 60 Hz AC generates ~29 Hz but newer VFD equipment moves frequencies with system demand • Do we want this? • Need tight imbalance requirements and single or multi-stage isolation • Large fluid cooler used to exhaust all TMT waste heat has 8 fans of Balance Quality Grade 1 • Results in 10 N of force per rotor or worst-case in-phase imbalance of all 8 rotors equal to 80 N • At 59 Hz even 1 kN should be acceptable but careful tracking of all equipment is required
Pipe vibration • Konstantinos Vogiatzis has made some initial models of turbulent flow in coolant pipes • Forces are low in straight runs, but elbows produce significant broad-band forces • TMT is considering replacing water-glycol with phase-change refrigerant to reduce coolant mass flow (and forces) by a factor of 10
Impact of increasing the error budget allocation to vibration • An increase from 14 nm to 30 nm would not dramatically reduce observing efficiency • Roughly 3% impact in J band
Things to do • On-going work needed to: • Develop the allowable vibration source budget allocated to subsystems • Improve estimate of propagation through soil (for enclosure and summit facility sources) • Improve all source estimates • Hopefully through force measurements made at a telescope near you!
Conclusions • Vibration sources on the telescope must be limited to a few Newtons • Vibration sources in the facility must be limited to a few hundred Newtons • Possibly need to increase AO error budget allocation to vibration • Further mitigation may be possible via • M2 feed-forward • Narrow-band rejection algorithms • Conventional cryocoolers are not acceptable for TMT • Keep summit facility source frequencies at 60 Hz when possible • Reduced sensitivities • Allows effective use of ~ 5 Hz isolators
Acknowledgements • The TMT Project gratefully acknowledges the support of the TMT partner institutions • the Association of Canadian Universities for Research in Astronomy (ACURA), • the California Institute of Technology • the University of California • the National Astronomical Observatory of Japan • the National Astronomical Observatories and their consortium partners • And the Department of Science and Technology of India and their supported institutes. • This work was supported as well by • the Gordon and Betty Moore Foundation • the Canada Foundation for Innovation • the Ontario Ministry of Research and Innovation • the National Research Council of Canada • the Natural Sciences and Engineering Research Council of Canada • the British Columbia Knowledge Development Fund • the Association of Universities for Research in Astronomy (AURA) • and the U.S. National Science Foundation.
You can build large structures without vibration problems • Mass helps • TMT dome = 2300 tons • Brunellesci’s dome = 37000 tons • The Duomo likely doesn’t have a vibration problem!