Download
1 / 48
500 likes | 677 Views
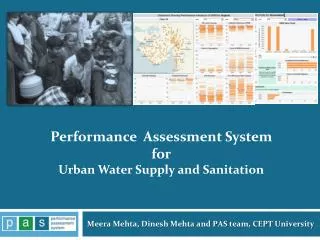
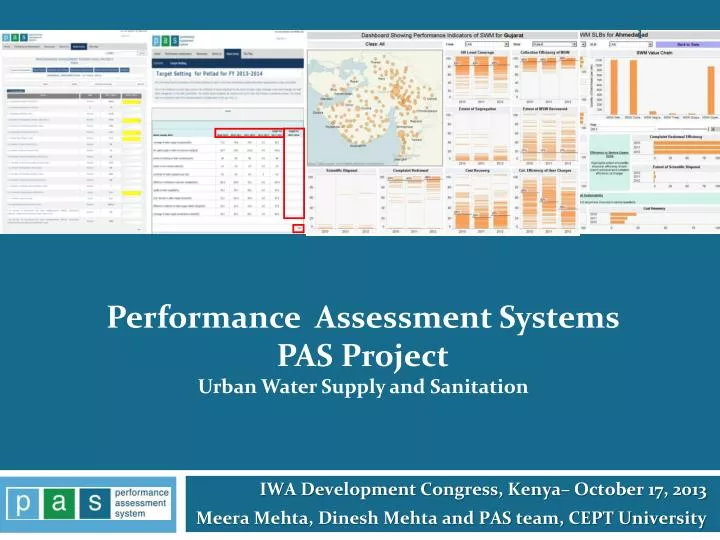
Performance Assessment Systems PAS Project Urban Water Supply and Sanitation. IWA Development Congress, Kenya– October 17, 2013 Meera Mehta, Dinesh Mehta and PAS team, CEPT University. Need for performance i nformation.

E N D
Performance Assessment Systems PAS ProjectUrban Water Supply and Sanitation IWA Development Congress, Kenya– October 17, 2013 Meera Mehta, Dinesh Mehta and PAS team, CEPT University
Need for performance information • Aggregate statistics suggest good coverage of water and sanitation in urban areas in India • BUT little is known about the quality, level and financial sustainability of service and only limited information on access of urban poorhouseholds to water and sanitation • Lack of WSS information leads to: • misallocation of resources and • it is difficult to assessimpact of past investments Need to move from Infrastructure funding to Improved service delivery using outcome liked funding
Performance Assessment System (PAS) Project • A major 7-year research grantfrom Bill and Melinda Gates Foundation to CEPT University for developing a statewide PAS in Maharashtra and Gujarat, and sanitation assessment and improvement • Implementation in partnership with Government of Maharashtra (UD and WSSD) and Government of Gujarat(UDD) • Partner institutions in each state • AIILSG for activities related to data collection and other field work in Maharashtra • UMC for activities related to data collection and other field work in Gujarat
PAS components A sustainable statewide Performance Assessment System to improve delivery of urban water supply and sanitation services Performance Monitoring at state and local level, role of civil society Performance Measurement with commonly agreed relevant key indicators Improved Urban Water and Sanitation Service Delivery Performance Improvement with consultative plans, innovative financing Focus on ULBs of all sizesFocus on the Poor
PAS Project – Timeline FRAMEWORK DEVELOPMENT MAINSTREAMING Performance Assessment Performance Measurement Performance framework Continuing web-based online assessments Information Improvement Plans Round I Scaling up to all states - State SLB Cells Performance Monitoring Develop regular annual reports, standard web-based ULB profiles Baseline Assessments Post Project Assessments PAS web portal, Exchange visits, Good practice documentation Use of performance information for setting priorities and monitoring Performance Improvement Sanitation framework across the value chain Support local governments in preparing Performance Improvement Plans Innovative sanitation financing options Support plans for ODF, wastewater management YEAR I YEAR 2 YEAR 3 YEAR 4 YEAR 5 YEAR 6 YEAR 7 YEAR 8 2009 2010 2011 2012 2013 2014 2015 2016
PAS Annual Service delivery profile for 419 Cities in 2States Performance Assessment System covering 32 Key indicators and 90 local action indicators Sectors : Water supply, Waste Water, Solid waste Management & Storm Water Old city area Newly developing colonies Focus on Measurement, Monitoring & Improvement
Key lessons: Global efforts • Adequate time required to set up robust systems – may range from 5 to 10 years • Once fully set up can be used for both outcome monitoring and making rational investment decisions • In the initial period support and funding are required to agree on and set up systems • A consultative process is needed for broad agreement on approach and implementation at national and state levels • Government ownership and regular reviews are essential
Aligning with the Government of India Initiative • Service Level Benchmarks (SLB)put the focus on measurement of service delivery performance. Benchmarks for four sectors: water supply, waste water, SWM and storm water • SLB Initiative focuses on • Collation of standardized indicators • Implementation of Management Information Systems (MIS)at city and state level • Development of Performance Improvement Plans (PIPs) • Addresses both internal monitoring for decision making and reporting to higher levels of government
Indicator Framework of PAS Project –SLB+ Themes to match with goals /targets of delivery of water supply and sanitation services Efficiency in service operations Universal access and coverage Themes under Performance Assessment Framework KPIs for performance assessment Equity in service delivery Service levels and quality Financial sustainability Drilled down indicators (LAIs) for actions for performance improvement
PAS - Sector wise Indicators and LAIs WATER SUPPLY WASTE WATER SOLID WASTE EQUITY 9 Key Indicators 36 Local action Indicators 9 Key Indicators 29 Local action Indicators 8 Key Indicators 12 Local action Indicators 4 Key Indicators 13 Local action Indicators STORM WATER 2 Key Indicators
Illustration of Goal-KPI-LAI links GOAL KEY PERFORMANCE INDICATOR LOCAL ACTION INDICATOR
Water Supply: Themes and local actions Access & Coverage WATER SUPPLY Efficiency in Service Operations 9 Key Indicators 36 Local action Indicators Coverage of distribution network, illegal connections, regularization Water audit, losses, pipe breaks, network refurbished, unbilled consumption, monitoring and analysis of complaints, functionality of meters, annual cost of losses, automated billing systems, collection systems Service levels & Quality Estimated demand and available supply, per capita supply, pressure at WDS and consumer end, quality tests, days of supply Equity Financial Sustainability Internal network in slums, uncovered HHs, policy provisions, connection procedures , budget for pro poor activities, connection charges, expenditure in slums Unit electricity cost, Staff, per capital revenue income and expenditure, average revenue per connection Set of Local Action Indicators help to better understand the results of the KPIs and also contextualise the city's service requirements to a great extent Also help arrive at local IMPROVEMENT priorities
Online data entry camps in state capitals PAS Project
Online Data Entry Modules • Layers of Approval of data submitted by City staff • City Chief Officer • State government officials
Time taken for annual assessment Annual Assessment in GUJARAT over five year assessment period 2010-11 2009-10 2008-09 2011-12 2012-13 2010-11 2009-10 2008-09 2011-12 2012-13 Annual Assessment in MAHARASHTRA over five year assessment period Support by State Government for Annual Assessment capacity building Training in use of tools Tools translated in local language Support for resolving data issues Constant hand holding by PAS team Data collection through city visits in Year I (2008-09), supported by Partners Data collection through online modules in Year V (2012-13). Self assessment by select ULBs
Planned online system for review • State Level (SLB cell) • Monitoring, policy, and recommendations 4 • District Collector • Monitoring, Verification of data/results 3 • Chief Officer • Monitoring, Verification of data 2 City (SLB cell) Data entry, verification 1
Web based measurement and monitoring Shared data available at various levels Data entry: at city level Data storage: at state level State agencies, data and analysis Cities – data, results, analysis Citizens Access to analysis, results
Information System Improvement Plans • Reliability of data needs to be improved • Two approaches: • In large/ metro cities strengthening internal systems for good performance information and linked to customized internal e-governance systems and monitoring • In smaller cities, state level support to link and integrate PAS online systems with common software
Performance Monitoring – through SLB Cells • PAS is mainstreamed through a State Cell for SLB assessment in both states • State Cells set up through Government Resolutions (GR) which also provide for state budgetary support for the SLB cell • Both GRs also provide terms of reference and time table for the State cell’s regular activities
Online Monitoring State profile of all SLBs Overview of all cities City profile of all SLBs Documentation of good practices
Dashboards showing Ranking of cities for Gujarat • Similar to human development index (HDI), urban development index (UDI) was calculated using 25 indicators identified under 4 dimensions: • Demography • Municipal services • Urban finance • Urban equity • The dashboard shows class-wise ranking as per the UDI value scored by a city. • The weightage for each dimension can be changed as and when required. • It also allows the user to locate the cities on the map to identify regions that are performing good or vice-versa.
Performance Monitoring – Other activities • Studies of state financing and monitoring systems for UWSS • Documentation of good practices • Exchange visits across cities • State workshops to share experiences • Access to good practices via PAS web portal • Reports describe finance and monitoring of urban water supply and sanitation in Maharashtra. It assesses the flow of funds in UWSS sector and the associated monitoring framework within the larger context of the urban sector in both States
Approach to performance improvement planning Conventional Approach PAS Approach ‘PROJECT’ based approach ‘SERVICE’ based approach Oriented towards OUTPUTS Oriented towards OUTCOMES SUPPLY DRIVEN Starting point is current performance – NEED DRIVEN Focus on INDIVIDUALPROJECTS Focus on SECTORAL SOLUTIONS Performance Assessment Systems (PAS) project, CEPT University, Ahmedabad
Performance Improvement Planning Tool IMPROVEMENT PLAN OPTIONS Excel based software for city level WSS planning Tool for planners, decision-makers Performance Assessment Systems (PAS) project, CEPT University, Ahmedabad
City Sanitation Plans in Small Towns • In partnership with State Government of Maharashtra (Water Supply and Sanitation Department, State utility (MJP) and local Municipalities • Plans cover elimination of open defecation, safe excreta disposal, black and grey management and solid waste management
Diagnostics of wastewater system – Sinnar 1.3 ML/Yr Periodic cleaning needs to be monitored Avoid indiscriminate dumping 428 ML/Yr 426 ML/Yr Provide treatment sites Avoid choking of drains through regular cleaning 1228 ML/Yr BLACK WATER Need to be designed as per prescribed standards Avoid soak pits where ground water tables are high 803 ML/Yr GREY WATER Avoid pollution of land and water bodies Existing Links In the value chain Missing Links In the value chain Areas for Intervention in the value chain User interface Collection/Storage Conveyance Treatment Reuse/disposal
Costs of sanitation options differ greatly! Capital expenditure Capital expenditure on regular sewerage network is almost double the other options! O&M expenditure
Business models for desludging services Business Model Household/ Non residential properties Household/ Non residential properties Monitoring Monitoring Urban Local Body (ULB) Urban Local Body (ULB) • Management Contract • Capital investment done by ULB • O & M services provided by Private • ULB pays a management Fee to Private sector • Monitoring of activities is done by ULB Tax payment Tax payment Contract Amount Management fee Rent payment for truck Monitoring Monitoring Collection of septage Collection of septage Rs. 12.3 lakhs/annum Private Sector Private Sector • PPP Mode • Capital investment and O & M done by Private • ULB pays a contract amount to Private sector • Monitoring of activities is don e by ULB Rs. 15.2 lakhs/annum PPP - Scenarios 50% Equity 100 % Equity Pay back – 2.2 Years ROE – 109% Pay back – 1.9 Years ROE – 73% Regulated Service : (Regular septic tank cleaning services will be provided say once in 3 years and also demand based service will be provided once in 3 years. For toilets other than HHs no. of services within 3 years can be increased and charged accordingly) Charges are part of Property tax or Levy User Fee per trip
Other areas of city support • Water audits and NRW reduction (10 cities) • Strategy for 24x7 water supply and ODF plan (15 cities) • Improvements in Cost Recovery and collection efficiency of tax for Water supply (4 cities) • Drinking water quality monitoring/ surveillance systems (3 cities) • Improvements in public grievances redressal system (5 cities) • Slum improvement access to WSS services (2 cities)
PAS Activities as National Technical Support Partner SUPPORT TO SLB NATIONAL STEERING COMMITTEE MEETINGS NATIONAL DATABASE FOR SLB BASELINE AND TARGETS ORGANISE CAPACITY BUILDING WORKSHOPS in over400+ cities in two states • In 2009, the Thirteenth Finance Commission’s recommendation provided incentives for State governments to assess and publish service levels and targets in the state gazette to avail performance-based grants for urban local bodies (ULBs). • The National Technical Support Partner will help mainstream SLB exercise through trainings for regularState and City level monitoring systems and its institutionalization. MoU with Ministry of Urban Development on Roll out in ALL States
Training programme for officials from Government of Nepal Training Program for Nepal DWSS Team – September 2013 • Training on methods and tools to measure, monitor and improve service delivery • Introduction to Performance Assessment Framework and relevant indicators to capture context of developing world. • Tools for online assessment and monitoring were also demonstrated to participants.
PAS Project global links • IWA specialist group for Performance Indicators and Benchmarking to influence global benchmarking efforts in looking at developing country contexts. • Formal partnership with The UNESCO-IHE (Netherland) in their Pro-poor Benchmarking (PROBE) programme • Membership and contributions to the Post-2015 deliberations for WASH, and waste water and groups
www.pas.org.in meeramehta@cept.ac.in dineshmehta@cept.ac.in pas@cept.ac.in Thank You